How to tell the difference between Summarize Custom Fields and Summarize Custom Fields Incrementally (Part 13) - Tip95
OBJECTIVE or GOAL
Welcome back to Get Empowered! In the last Empower tip-of-the-week post for Empower Chromatography Data Software, we learned how to create Intersample Custom Fields with a summary function (Tip #94).
This week, we will learn the difference between Summarize Custom Fields and Summarize Custom Fields Incrementally (Part 13).
Creating Custom Fields in Empower:
- #82: The basic steps on creating a Custom Field
- #83: How to create a Custom Sample Set Field
- #84: How to create a Component Custom Field
- #85: How to create a Peak Custom Field
- #86: How to copy a Custom Field from one project to another
- #87: How to modify a Custom Field
- #88: How to create a Result Custom Field
- #89: How to modify a Custom Field that applies to specific samples and/or specific peaks
- #90: How to use Empower to evaluate whether the sample meets specific criteria
- #92: How to create one custom field to determine a sample pass/fail
- #93: How to create an Intersample Custom Field
- #94: How to create Intersample Custom Fields with a summary function
Recently a subscriber asked me the difference between Summarize Custom Fields and Summarize Custom Fields Incrementally. Here are the simple definitions:
- Summarize Custom Fields provides the overall summary in the Sample Set
- Summarize Custom Fields Incrementally provides an ongoing summary thru out the sample set.
Now, let me show you the difference.
ENVIRONMENT
- Empower
PROCEDURE
- An Intersample Custom Field is created to calculate the average area for a peak in replicate injections of Standard 3 (Figure 1).
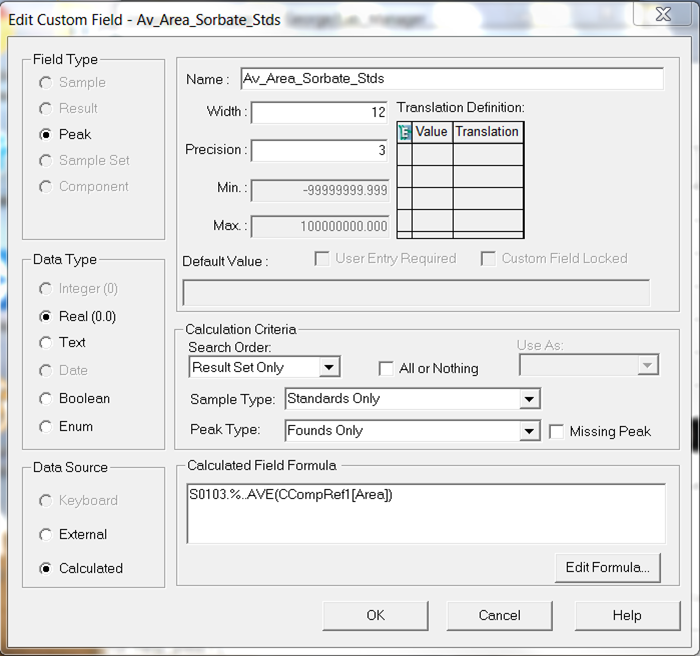
Figure 1
- Summarize Custom Fields Incrementally is inserted after the first injection of Standard 3 and then again after the second and third (Figure 2).
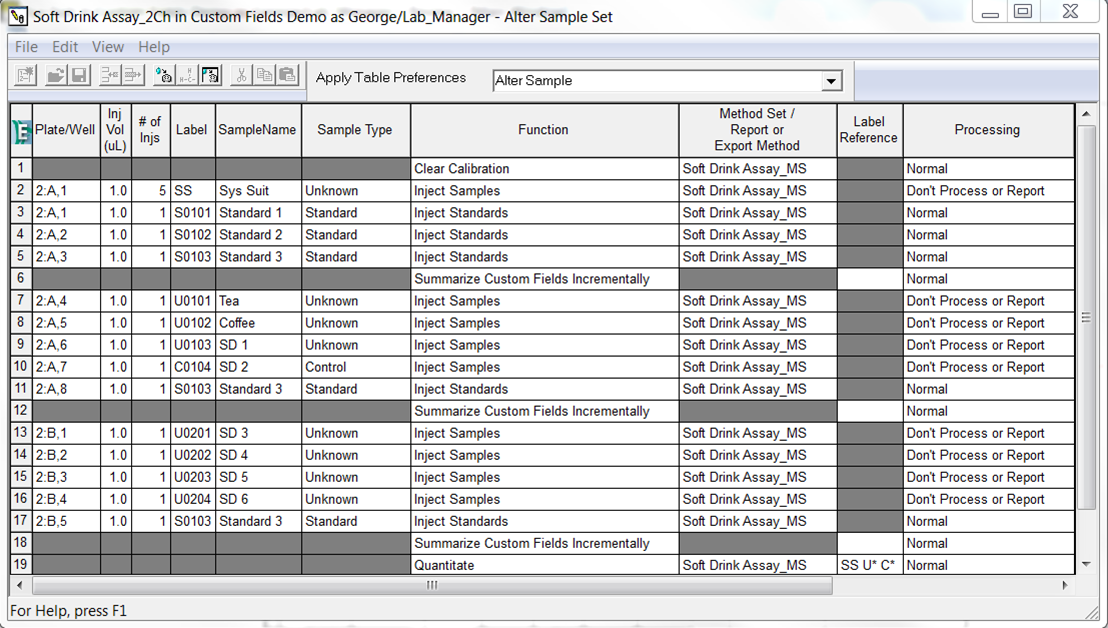
Figure 2
- After processing the Sample Set, we can see the results in Review. For example, the ‘area’ for the peak and the ‘average area’ for the peak after the first injection of Standard 3 are the same since there is only one injection at this point in the Sample Set, 373469 (Figure 3).
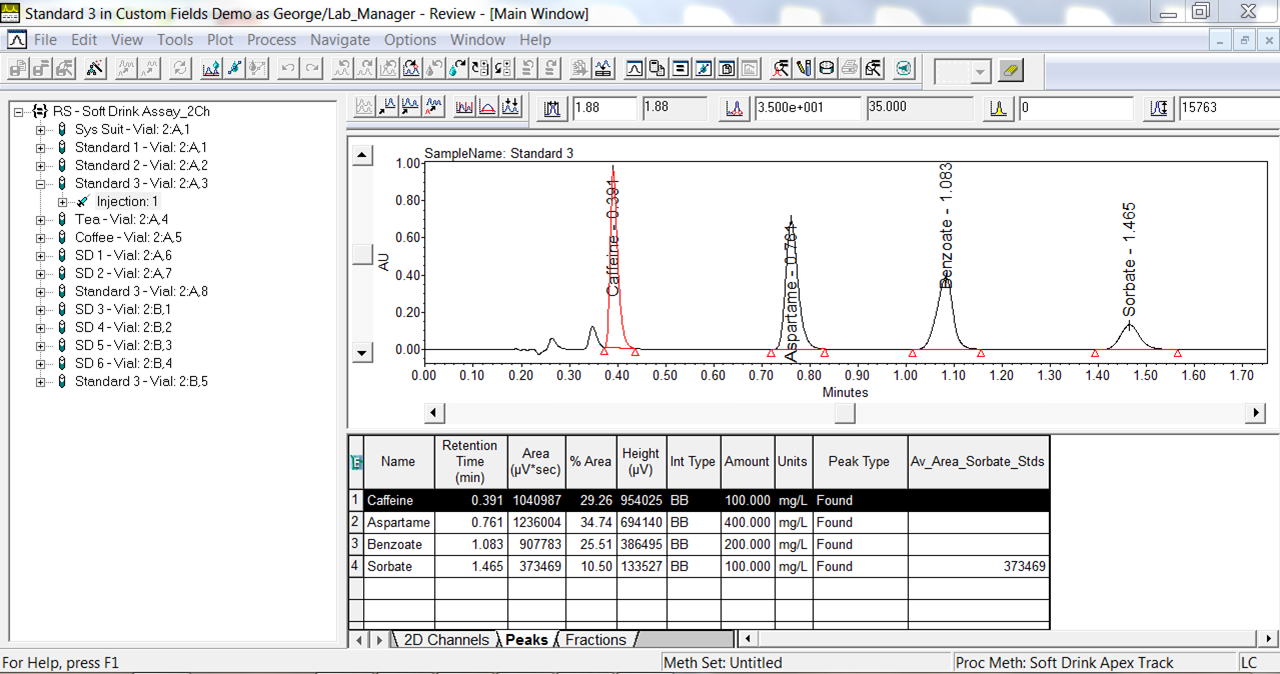
Figure 3
- After the second, the average is 361690 (Figure 4).
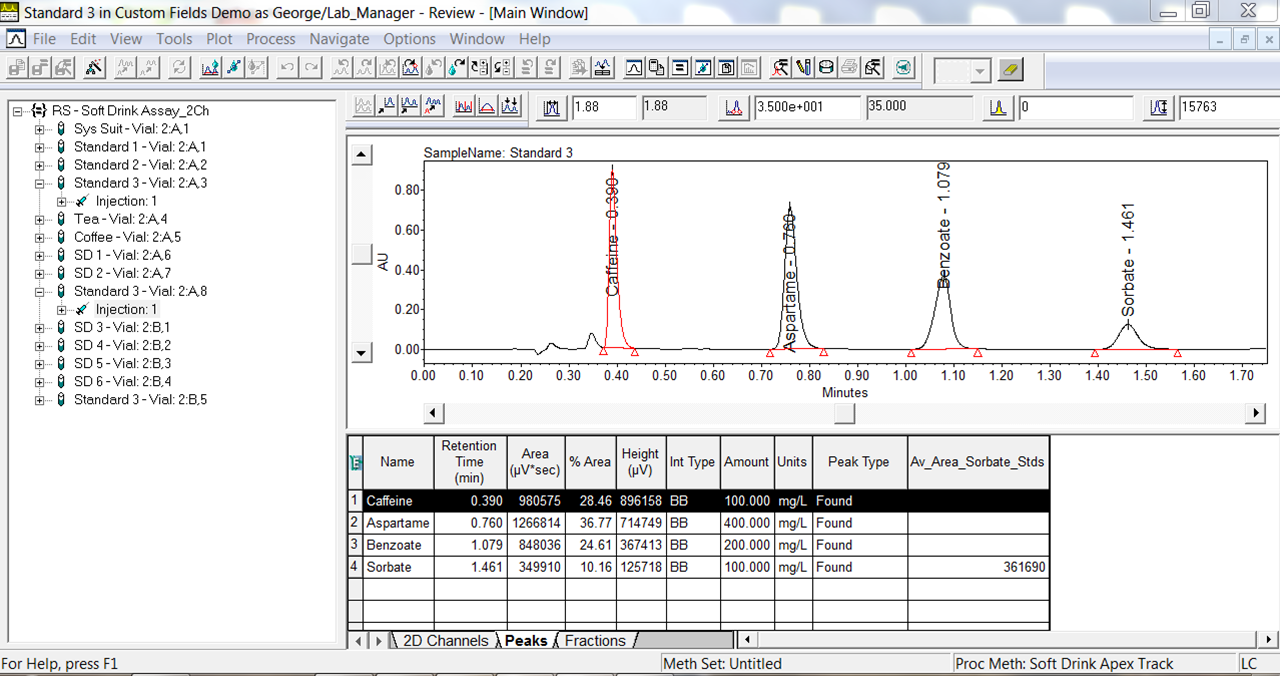
Figure 4
- After the third, the average is 349655 (Figure 5).
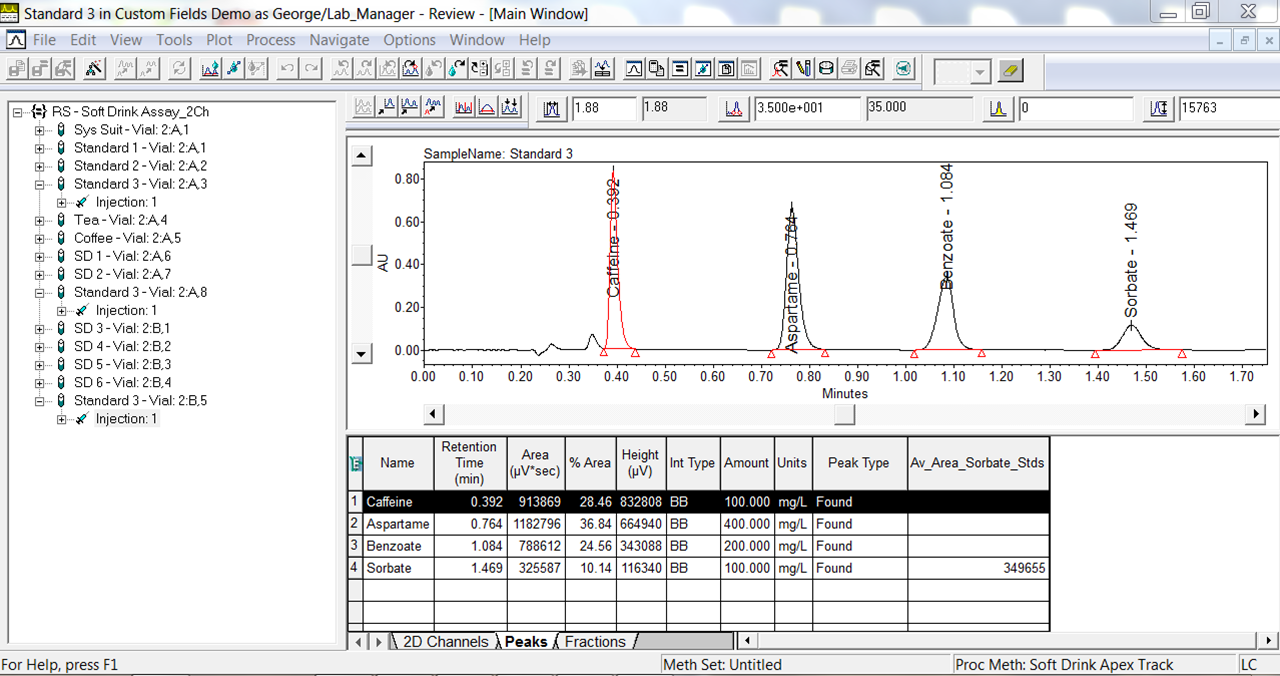
Figure 5
It’s that easy!
ADDITIONAL INFORMATION
Final note: This procedure can be followed using the QuickStart or Pro interface
id56928, EMP2LIC, EMP2OPT, EMP2SW, EMP3GC, EMP3LIC, EMP3OPT, EMP3SW, EMPGC, EMPGPC, EMPLIC, EMPOWER2, EMPOWER3, EMPSW, SUP