How to Create a Result Custom Field in Empower - Tip88
OBJECTIVE or GOAL
Welcome back to Get Empowered! In the last Empower tip-of-the-week post for Empower CDS Software, we learned how to modify a Custom Field (Tip #87).
Creating Custom Fields in Empower:
- #82: The basic steps on creating a Custom Field
- #83: How to create a Custom Sample Set Field
- #84: How to create a Component Custom Field
- #85: How to create a Peak Custom Field
- #86: How to copy a Custom Field from one project to another
- #87: How to modify a Custom Field
This week, we will learn how to create a Result Custom Field (Part 7).
In Tip#85, we learned how to create a Peak Custom Field. A Peak Custom Field is a user-defined calculation pertaining to a peak or peaks within the chromatogram. A Peak Custom Field might produce multiple results for the chromatogram. A Result Custom Field is a user-defined calculation pertaining to all of the peaks in the chromatogram and, as a result, produces one result for the entire chromatogram. Today we will create a Result Custom Field to calculate the average peak width of the peaks in our chromatogram. This information is helpful when creating or fine-tuning a processing method.
Let’s get started.
ENVIRONMENT
- Empower
PROCEDURE
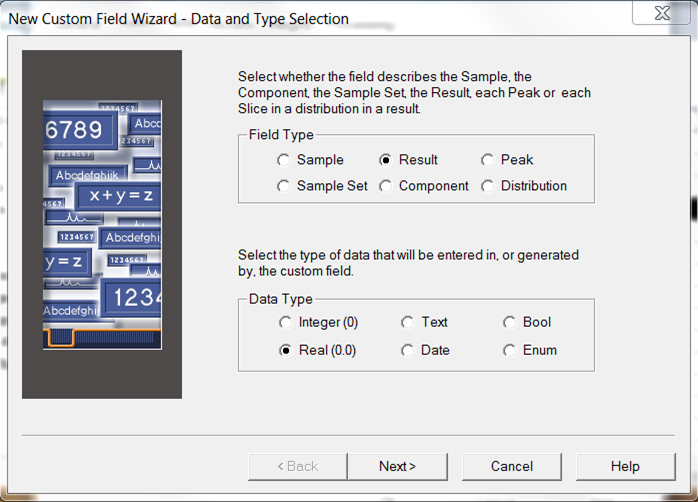
- Launch the new Custom Field wizard and on the Data and Type Selection screen select Result for the field type and Real for the data type.
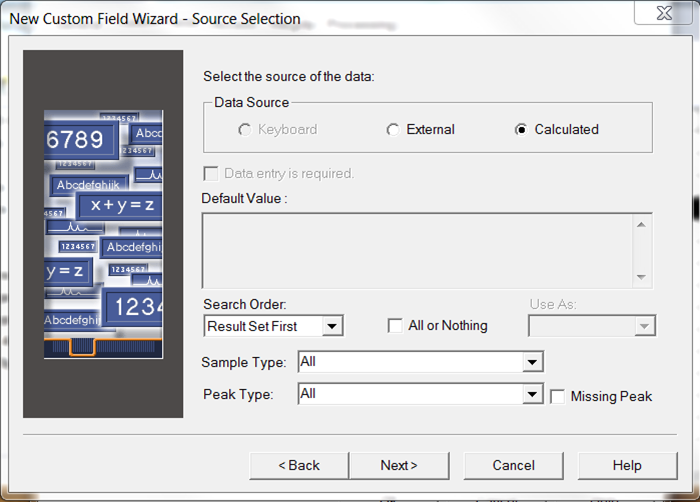
- On the Source Selection screen, the data source defaults to Calculated. Whenever you select either field type Peak or Result, Empower understands that you want to make a calculation.
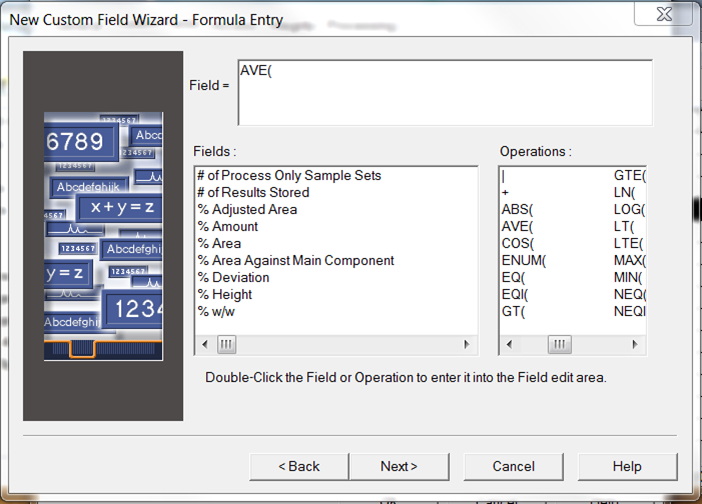
- On the Formula Entry screen, scroll to the right in the Operations area, locate AVE( and double-click to add it to the Field area.
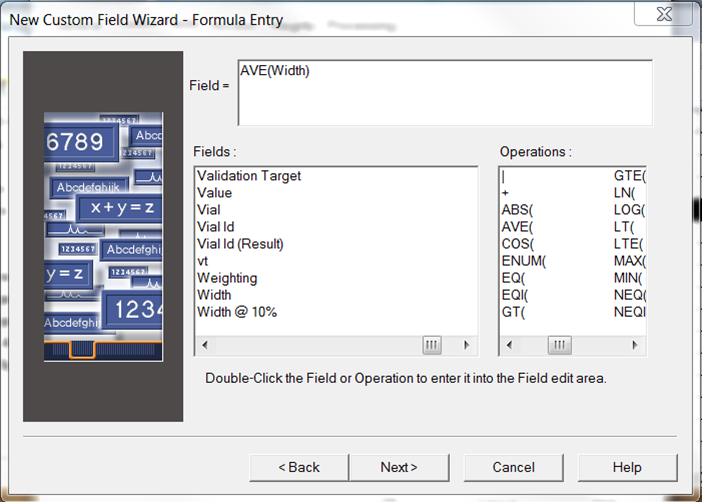
- Scroll to the right in the Fields section and locate Width. Double-click Width to add it to the Field area. Finally, add the right parenthesis character ) to close the equation.
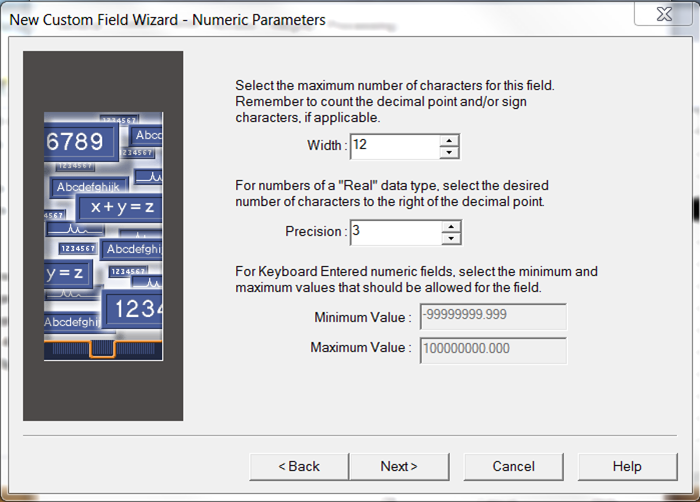
- On the Numeric Parameters screen, set the desired width.
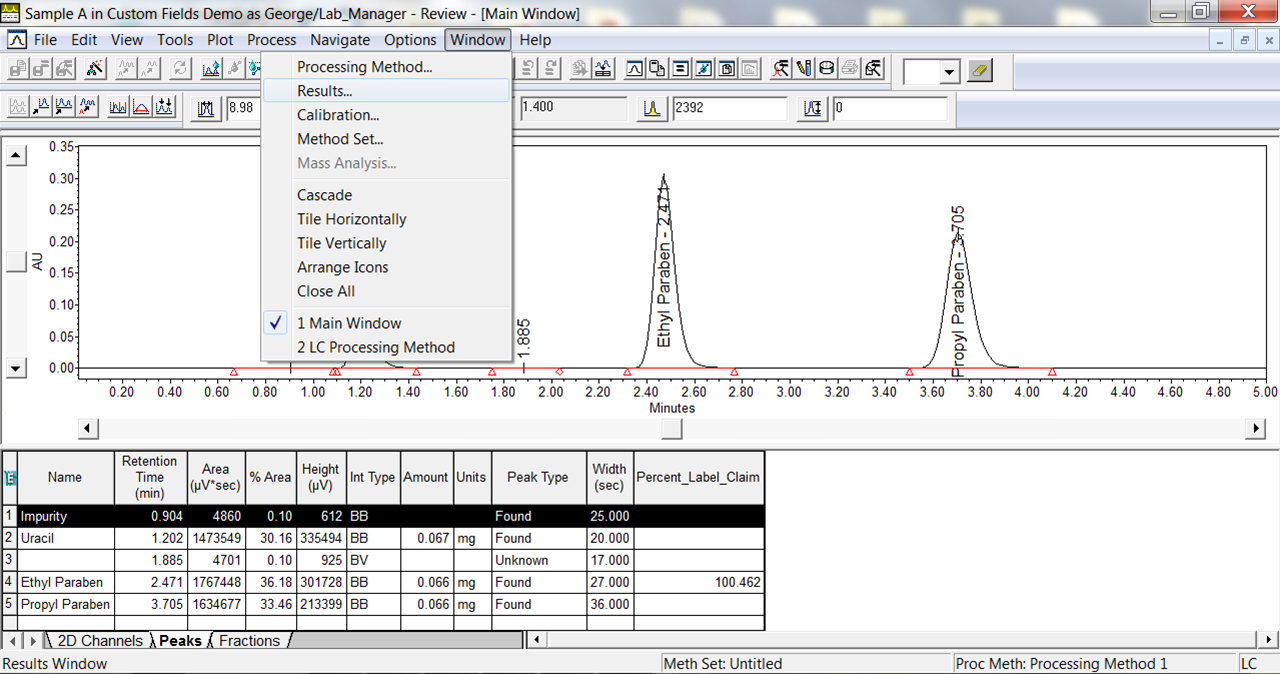
- Once the Custom Field has been saved, open the project, process a Sample Set, select a result, and open Review. A Result Custom Field will be visible in the Results window within Review. From the Windows menu, select Results.
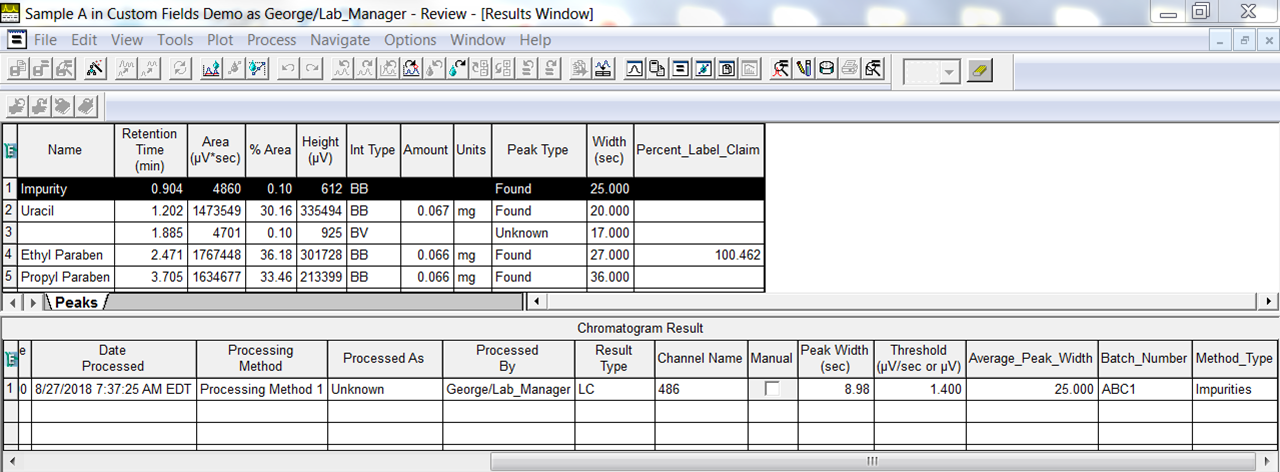
- The individual peak widths are seen in the Peaks table and the Average Peak Width is seen in the Chromatogram Result table.
It’s that easy!
ADDITIONAL INFORMATION
- This procedure can be followed using the QuickStart or Pro interface.
id69015, EMP2LIC, EMP2OPT, EMP2SW, EMP3GC, EMP3LIC, EMP3OPT, EMP3SW, EMPGC, EMPGPC, EMPLIC, EMPOWER2, EMPOWER3, EMPSW, SUP