How to use CODA in the Processing Method or in the Method Set - Tip110
OBJECTIVE or GOAL
Welcome back to Get Empowered! In the last Empower tip-of-the-week post for Empower Chromatography Data Software, we learned about MS Peak Tracking in Empower (Tip #109).
Working with ACQUITY QDa MS data in Empower:
- #100: How to view the base mass and mass spectra for the peaks in a chromatogram
- #101: How to work with 2D ACQUITY QDa MS data
- #103: Viewing different spectral views in the Mass Analysis window
- #104: Extracting chromatograms and spectra while working in the Mass Analysis window
- #105: Why it is important to align chromatograms when collecting data from both a PDA and a QDa mass detector
- #106: How to optimize sensitivity by extracting a single mass rather than working with a TIC plot
- #107: How to smooth the chromatogram using the Processing Method
- #108: How to smooth the chromatogram using a Derived Channel in the Method Set
- #109: How to track peaks using the ACQUITY QDa mass detector
In Tip 58, we learned how to use CODA as part of a Derived Channel. You do have the option to use CODA either in the Processing Method or in a Derived Channel in a Method Set. There may be times when using CODA in the Processing Method or in the Method Set may be advantageous.
This week we will learn how to use CODA in the Processing Method or in the Method Set.
Let’s get started.
ENVIRONMENT
- Empower
PROCEDURE
- We start by looking at a TIC plot for a 3D MS channel in Review without a Method Set or a Processing Method (figure 1).
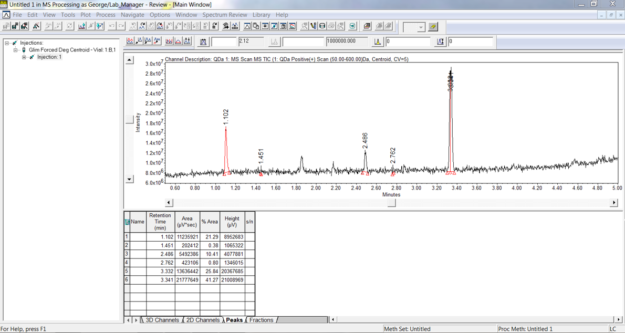
Figure 1
- On the MS 3D Channel tab of the untitled Processing Method, we can turn on CODA with the default settings. Remember that CODA is an algorithm designed to reduce random noise and high background to simplify interpretation of the LC/MS data (figure 2). (NOTE: Be sure to tick the box that says Enable 3D MS Channel Processing.)
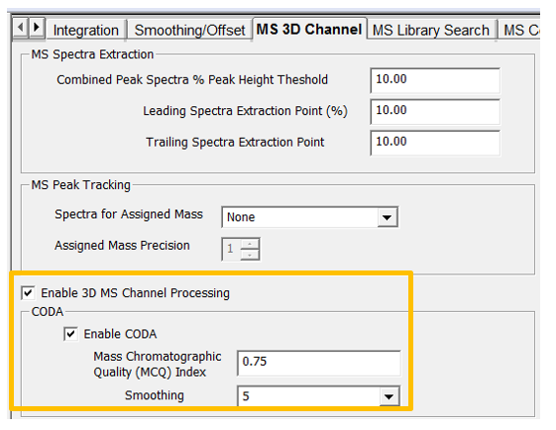
Figure 2
- We now see a Stack plot of the original noisy TIC plot with the TIC plot with CODA applied. CODA ‘retains’ mass chromatograms which contain information (peaks) in the data and ‘removes’ mass chromatograms which add noise to the TIC plot (figure 3).
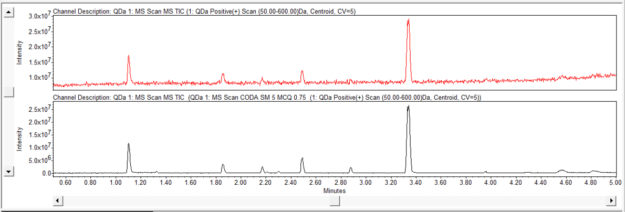
Figure 3
Without a Method Set or a Processing Method, we can see an improvement to our TIC plot with CODA. We can use this as a tool to scout for peaks in our TIC plot. Let’s see how that is done.
- Create a Method Set with a Derived Channel for a TIC plot. Create a second Derived Channel with a TIC plot and then turn on CODA on the MS CODA tab of the Derived Channel dialogue box (figure 4).
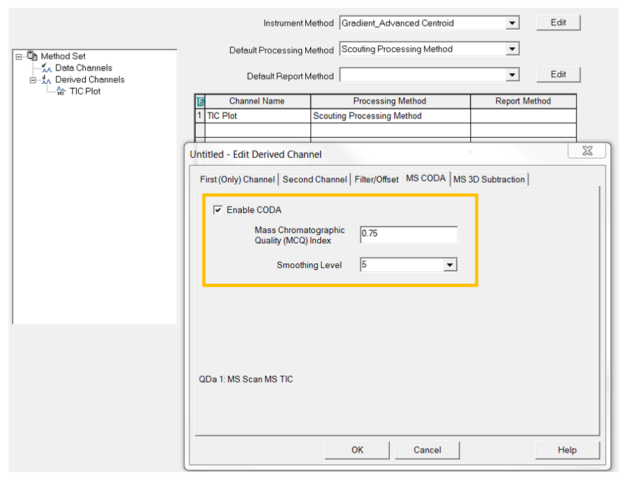
Figure 4
Create a very simple Processing Method with Inhibit Integration for the entire chromatogram and use that Processing Method for both Derived Channels (figure 5).
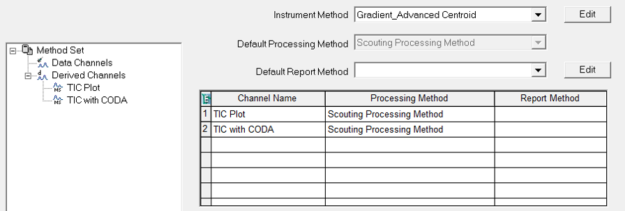
Figure 5
Step 6
Applying the Method Set gives us the same result I received Step 3 (figure 6).
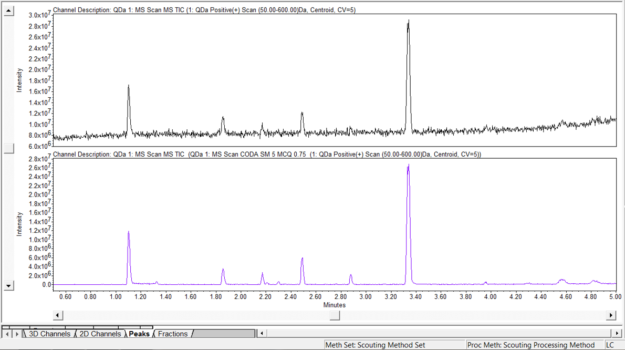
Figure 6
Either way, the TIC plot with CODA displays improved peak shapes for the small peaks and reveals small peaks that we could not see in the original TIC plot. The advantage to using the Method Set is that you can bring an injection into Review and open/apply the Method Set, and in just a few clicks, I have an improved TIC plot which can be used to further interrogate the peaks.
It’s that easy!
ADDITIONAL INFORMATION
Final notes:
- You can add smoothing in the Derived Channel dialogue box on the Filter/Offset tab to further improve the chromatogram.
- This procedure can be followed using the QuickStart or Pro interface.
- ACQUITY QDa Mass Detector is compatible with the Alliance HPLC system.
id59748, EMP2LIC, EMP2OPT, EMP2SW, EMP3GC, EMP3LIC, EMP3OPT, EMP3SW, EMPGC, EMPGPC, EMPLIC, EMPOWER2, EMPOWER3, EMPSW, SUP