How to automate the use of the library to identify peaks in sample chromatograms - Tip114
Article number: 60831
OBJECTIVE or GOAL
Welcome back to Get Empowered! In the last Empower tip-of-the-week, we learned how to use a library of MS spectra to identify spectra from unknown peaks via the manual technique.
This is part 3 to the series and we will learn how to automate the use of the library to identify peaks in sample chromatograms by adding the library search to the Processing Method. The first benefit of doing it this way is that Empower will automatically take the apex spectrum of every integrated peak and compare them to the spectra in the library. The second benefit is that you can search against multiple libraries.
Let’s see how it’s done!
ENVIRONMENT
- Empower
PROCEDURE
- We start by bringing data with the unknown peaks into Review. Once the Method Set has been opened and applied, go to the Processing Method and click on the MS Library Search tab.
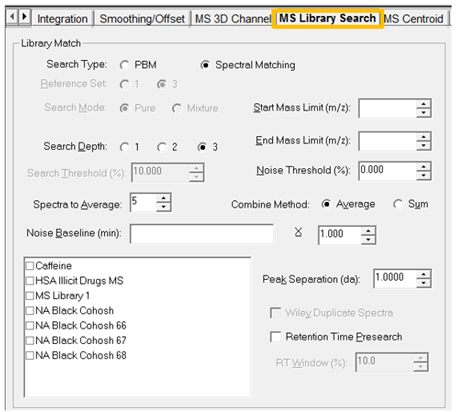
- The default settings are displayed when you make a new processing method. Let’s first understand what these settings are, and we can use them accordingly.
- Search Depth has a maximum of 3. Please see last week’s Empower Tip of the week for a more detailed description.
- Start Mass and End Mass - Limits the search to library spectra with masses within the specified range.
- Noise Threshold % - Removes noise from spectral data before a library search. The threshold value is applied as a percentage of the Base Peak intensity. Mass intensity values in the sample spectrum less than the Threshold value are set to zero.
- Spectra to Average - Number of spectra to be averaged to produce the extraction. When spectra are extracted, they can be averaged over a series of scans to reduce the noise level in the spectra. For example, a value of 1 indicates no averaging. A value of 3 averages the extracted spectrum with the spectrum on each side of the extracted spectrum.
- Combine Method - Indicate how to combine a spectrum: Average averages the intensities of the spectrum and Sum adds the intensities of the spectrum.
- Noise Baseline - A value that specifies in minutes how Empower software calculates a baseline spectrum. When you enter a range, Empower software averages all spectra in the specified time ranges to produce a noise spectrum, which is subtracted from any extracted spectra. See Tip of the Week 111 which discusses MS 3D Subtraction for information on entering the time values and the description of the Multiplier.
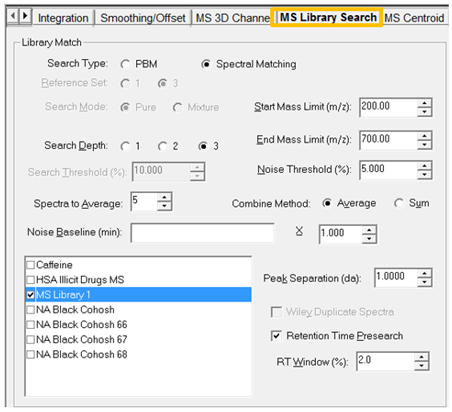
- Library list – select the Library or Libraries you want to use.
- Peak Separation – Binning value to apply to the baseline-corrected spectrum. Empower software bins the extracted and combined spectrum at the resolution in this field.
- Retention Time Presearch – Please see last week’s Empower Tip of the Week for a detailed description.
- Once you have made the appropriate selections be sure to save the Processing Method.
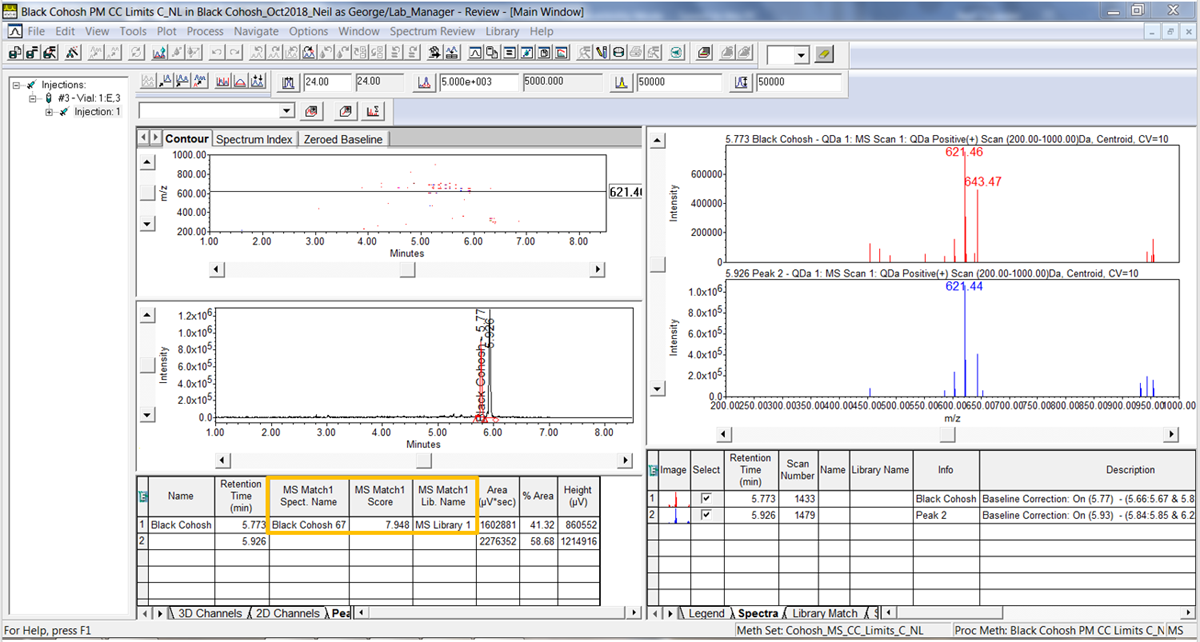
- Reapply the Method Set and we now see the results in the Peaks table under the chromatogram. This information will be part of the result.
- Go to the Results window and click the MS Library Match tab. Here we see the 3 results for the peak with the best match (the highest MS Match Score) at the top of the list.
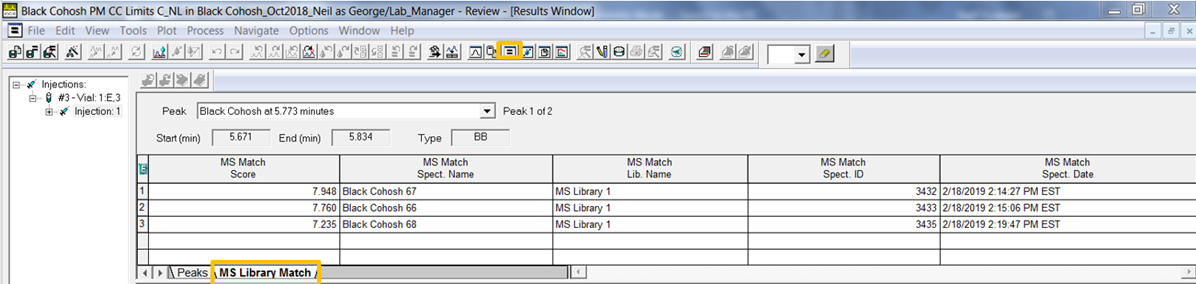
It’s that easy!
ADDITIONAL INFORMATION
- This procedure can be followed using the QuickStart or Pro interface.
- For information on Empower training please go to www.waters.com/training and select Empower from the Topic menu.