How to display spectra from a particular MS scan along with UV spectra in the Mass Analysis window - Tip115
Article number: 60852
OBJECTIVE or GOAL
Welcome back to Get Empowered! In the last Empower tip-of-the-week, we learned how to use a library of MS spectra to identify spectra from unknown peaks via the automated technique.
Today I would like to answer a question which I have received from several readers. If I have collected multiple 3D scans with my QDa how do I display spectra from a particular MS scan along with my UV spectra in the Mass Analysis window?
Let’s see how it’s done!
ENVIRONMENT
- Empower
PROCEDURE
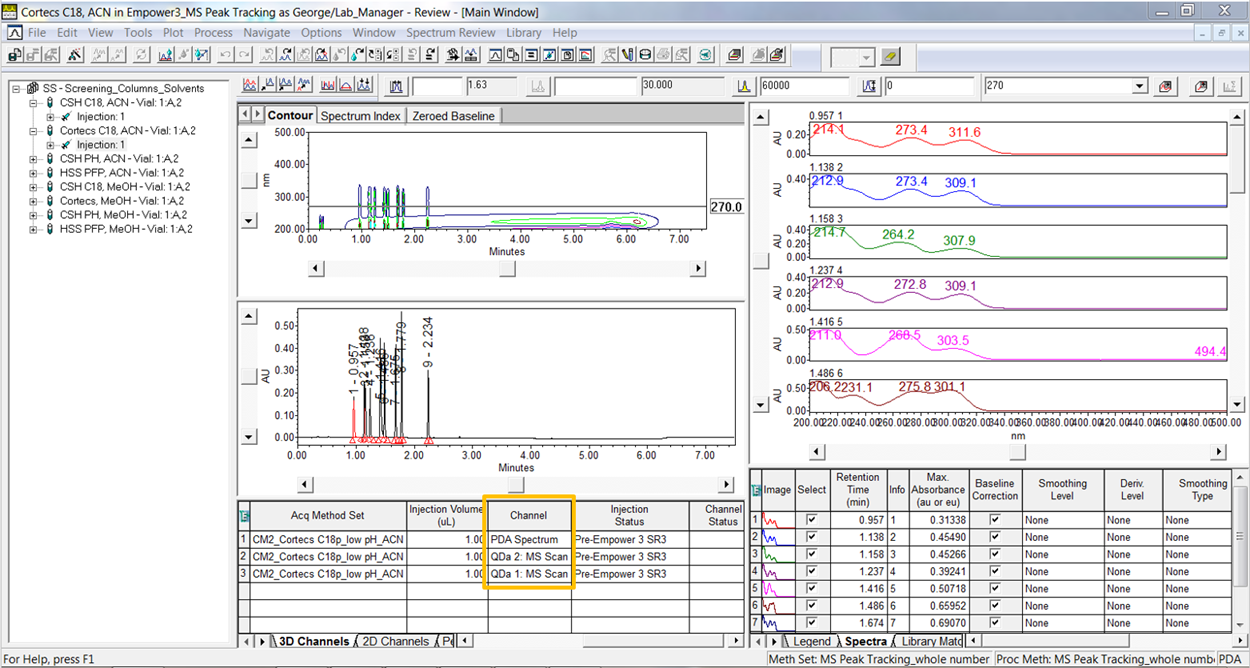
- We start in the Main Window of Review and see the PDA scan and the 2 MS scans listed in the 3D Channels table.
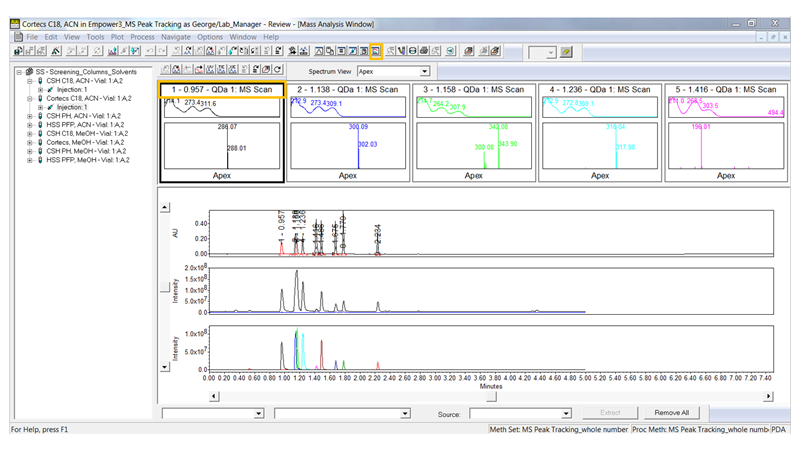
- In the Mass Analysis Window we see the UV spectra and MS spectra from QDa 1 scan.
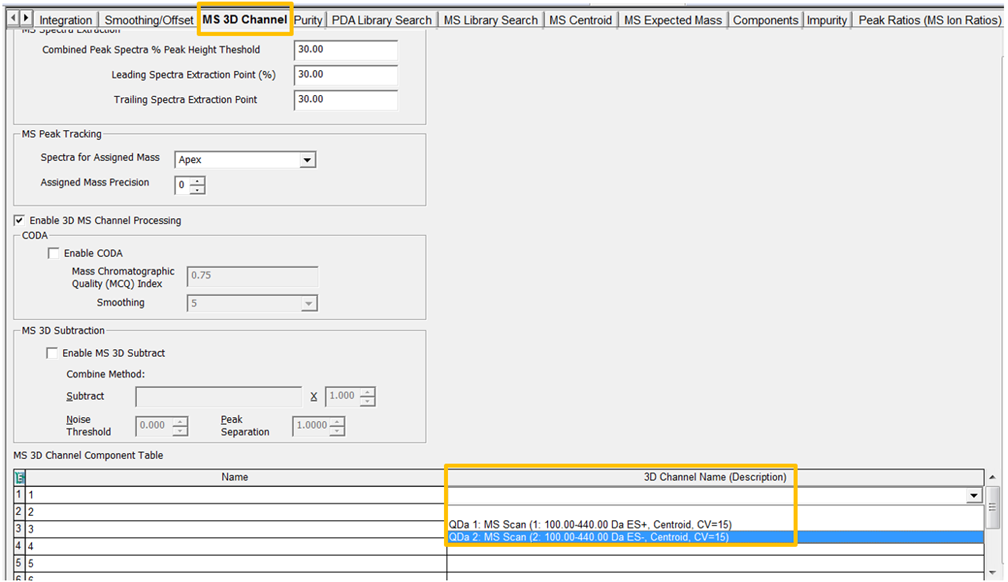
- Go to the Processing Method and select the MS 3D Channel tab. Towards the bottom of the window you can select which MS scan you would like to use on a peak by peak basis from the 3D Channel Name (Description) field.
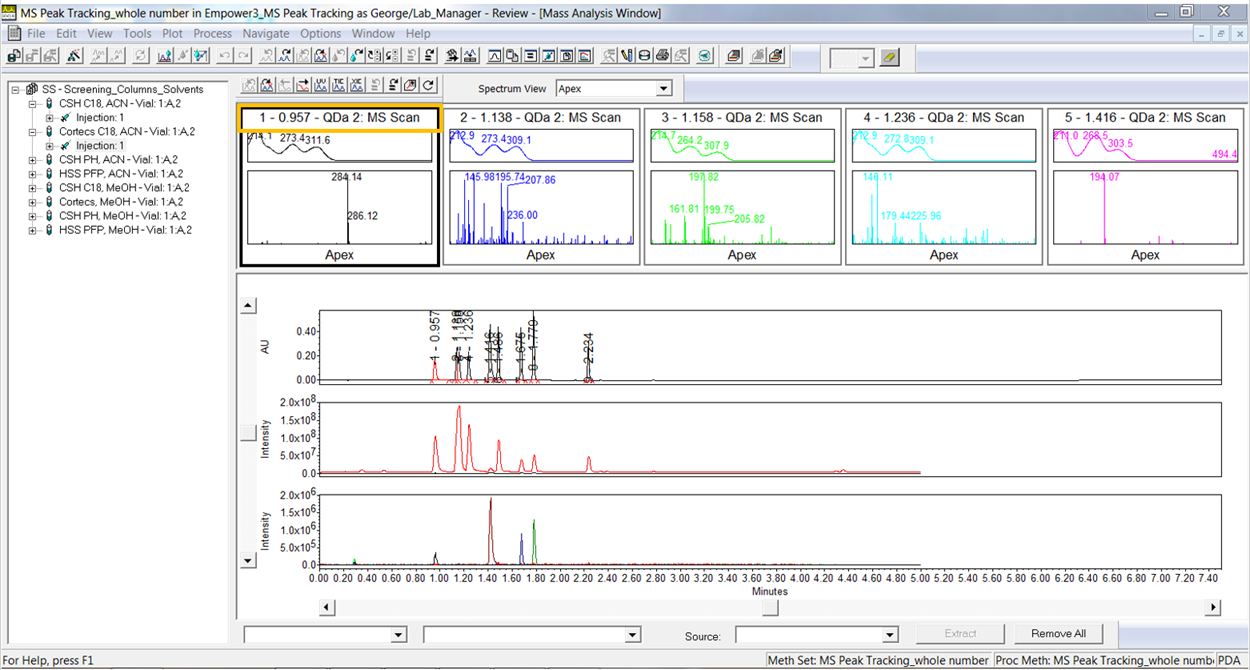
- Reapply the Method Set and we now see the UV spectra and the MS spectra from QDa 2 scan in the Mass Analysis window.
It’s that easy!
ADDITIONAL INFORMATION
Final Notes
- This procedure can be followed using the QuickStart or Pro interface.
- For information on Empower training please go to www.waters.com/training and select Empower from the Topic menu.