How to smooth the chromatogram (Part 7) - Tip107
OBJECTIVE or GOAL
Welcome back to Get Empowered! In the last Empower tip-of-the-week post for Empower Chromatography Data Software, we learned how to optimize sensitivity by extracting a single mass rather than working with a TIC plot (Tip #106).
Working with ACQUITY QDa MS data in Empower:
- #100: How to view the base mass and mass spectra for the peaks in a chromatogram
- #101: How to work with 2D ACQUITY QDa MS data
- #103: Viewing different spectral views in the Mass Analysis window
- #104: Extracting chromatograms and spectra while working in the Mass Analysis window
- #105: Why it is important to align chromatograms when collecting data from both a PDA and a QDa mass detector
- #106: How to optimize sensitivity by extracting a single mass rather than working with a TIC plot
This week we are going to learn why smoothing the chromatogram can be helpful (Part 7). If the baseline is noisy you can use a small amount of smoothing to improve the baseline and the signal to noise ratio. Please note: Be careful, smoothing algorithms smooths all data points, not just baseline points. If you apply to high of a smoothing factor you can smooth away your peaks.
Let’s get started.
ENVIRONMENT
- Empower
PROCEDURE
- We start without any smoothing and see the peak of interest has a signal to noise ratio of 29:1 (figure 1).
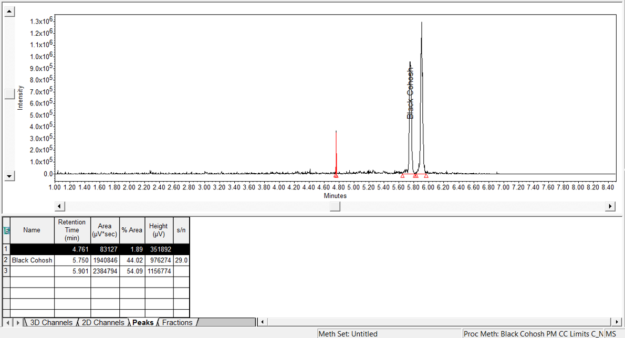
Figure 1
- If you go to the Results window within Review, there is more information. We see the height, signal to noise ratio, and the peak to peak noise which is 33659 (figure 2).
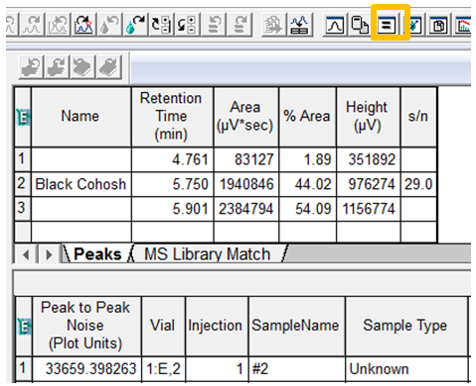
Figure 2
Now we apply a small amount of smoothing using the Smoothing/Offset tab in the Processing Method (figure 3).
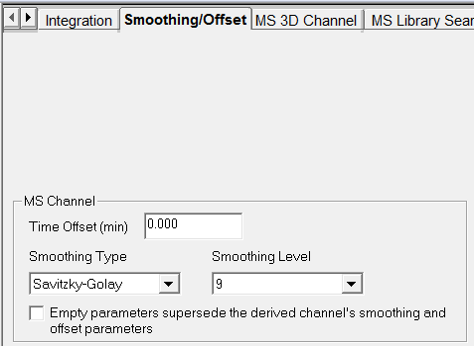
Figure 3
Step 4
The signal to noise ratio for our peak of interest is now 42:1 (figure 4).
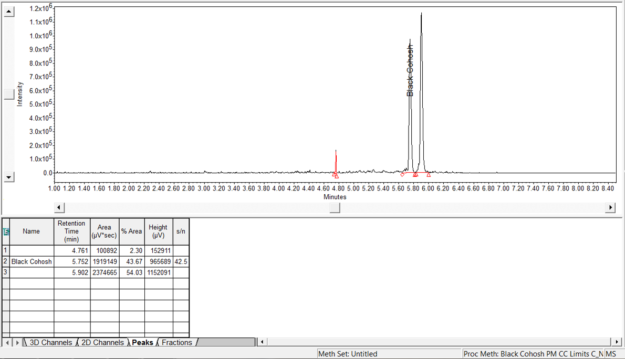
Figure 4
Step 5
Returning to the Results window, we see a slight reduction in peak height and a significant reduction in the peak to peak noise to 22715 (figure 5).
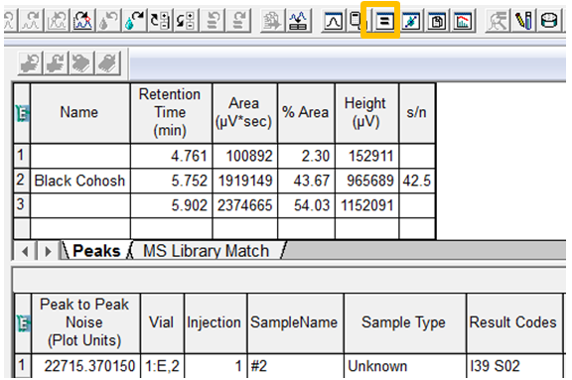
Figure 5
It’s that easy!
Here’s a Question: In Tip #47, we covered deriving a channel and applying a smoothing factor to the Derived Channel. Is there an advantage to smoothing via the Processing Method or via a Derived Channel? Stay tuned in, I will provide the answer in next weeks’ tip.
ADDITIONAL INFORMATION
Final notes:
- Savitzky-Golay smoothing averages data points. For more detailed information, check out the book called Chromatographic Integration Methods by Norman Allen Dyson. There is a good section on filtering and smoothing chromatographic signals.
- This procedure can be followed using the QuickStart or Pro interface.
- ACQUITY QDa Mass Detector is compatible with the Alliance HPLC system.