How to work with 2D ACQUITY QDa MS data - Tip101
Article number: 57459
OBJECTIVE or GOAL
Welcome back to Get Empowered! In the last Empower tip-of-the-week post for Empower Chromatography Data Software, we learned how to view the base mass and mass spectra for the peaks in a chromatogram (Tip #100).
This week, we will learn how to work with 2D ACQUITY QDa MS data (SIR which is ‘Single Ion Recording’ of data at a particular mass) and create a basic LC Processing Method for quantitative analysis. Which tabs of the Processing Method do I need to use?
Let’s get started.
ENVIRONMENT
- Empower
PROCEDURE
- Bring the 2D channels for standards and samples into Review. In this case, we are quantitating Aspartame, an artificial sweetener used in soft drinks. The mass is 295.2.
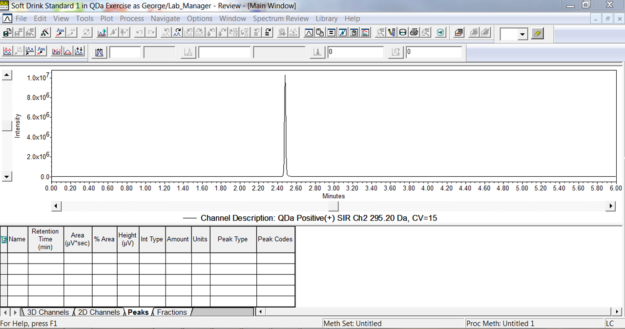
Figure 1
- Once the peak detection and integration parameters have been set, you may want to include ‘smoothing’ depending on the Signal to Noise ratio. In this case, it is not needed (figure 2).
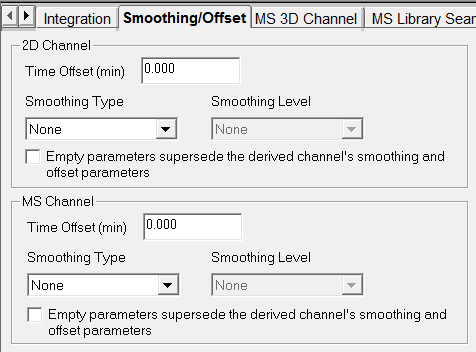
Figure 2
- On the Components tab, enter the ‘peak name’ and any other pertinent information. In this case, the method calls for a quadratic fit for the calibration curve (figure 3).
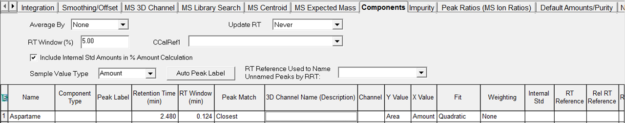
Figure 3
- Optionally turn on System Suitability to have Signal to Noise, plate count and so forth calculated. Save the method and test on your standards and samples (figure 4).
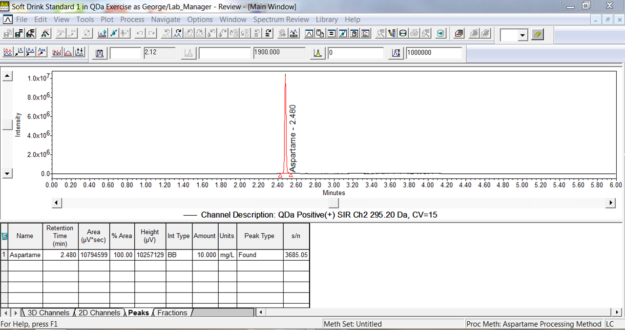
Figure 4
- Once the Sample Set has been processed, take the Result Set into Review, and view the calibration curve (figure 5).
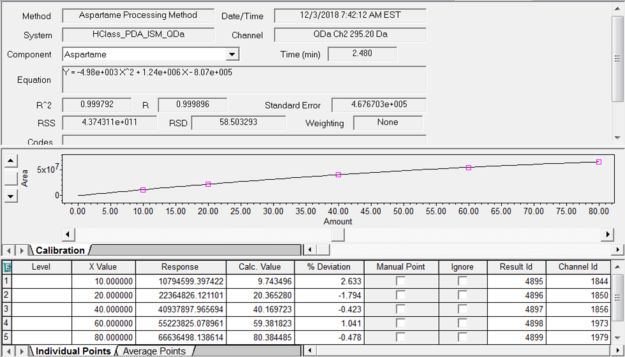
Figure 5
- Review the samples to view the amount (or concentration) of Aspartame (figure 6).
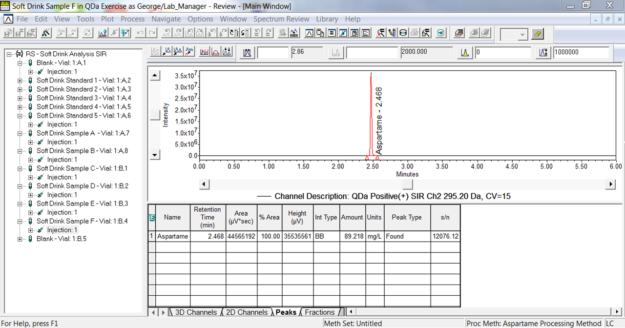
Figure 6
As you can see it is no different that working with 2D UV data.
It’s that easy!
ADDITIONAL INFORMATION
Final notes:
- This procedure can be followed using the QuickStart or Pro interface.
- ACQUITY QDa Mass Detector is compatible with the Alliance HPLC system.
id57459, EMP2LIC, EMP2OPT, EMP2SW, EMP3GC, EMP3LIC, EMP3OPT, EMP3SW, EMPGC, EMPGPC, EMPLIC, EMPOWER2, EMPOWER3, EMPSW, SUP