How to optimize sensitivity by extracting a single mass rather than working with a TIC plot (Part 6) - Tip106
OBJECTIVE or GOAL
Welcome back to Get Empowered! In the last Empower tip-of-the-week post for Empower Chromatography Data Software, we learned why it is important to align chromatograms when collecting data from both a PDA and a QDa mass detector (Tip #105).
Working with ACQUITY QDa MS data in Empower:
- #100: How to view the base mass and mass spectra for the peaks in a chromatogram
- #101: How to work with 2D ACQUITY QDa MS data
- #103: Viewing different spectral views in the Mass Analysis window
- #104: Extracting chromatograms and spectra while working in the Mass Analysis window
- #105: Why it is important to align chromatograms when collecting data from both a PDA and a QDa mass detector
This week, we are going to learn how to optimize sensitivity by extracting a single mass rather than working with a TIC plot (Part 6). This is somewhat analogous to extracting a single wavelength rather than working with a MaxPlot when working with the PDA data.
Let’s get started.
ENVIRONMENT
- Empower
PROCEDURE
- We start by bringing a 3D MS Scan into review and applying the appropriate Method Set. The Processing Method is set up to integrate the main peaks and calculate the signal to noise ratio for each (figure 1). (Note: the signal to noise ratio for Peak 6 is 13.3).
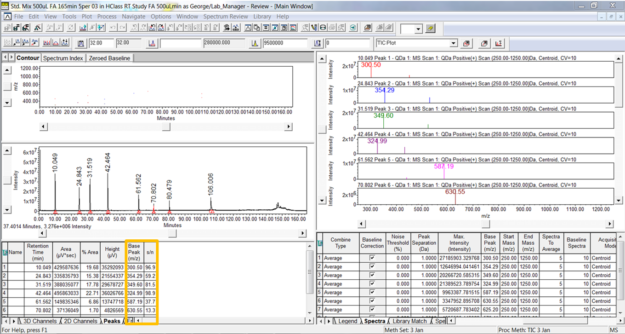
Figure 1
- To optimize sensitivity for Peak 6, we can derive a single mass and add it to our Method Set. In this case, we derive 630.55, which is the base mass for this peak (figure 2). (Refer back to Tip#56 which explains how to derive a single mass).
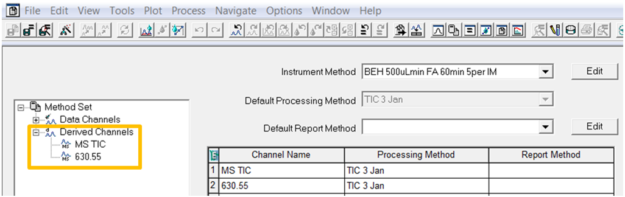
Figure 2
- Alternatively, we could use the ‘Extract Choices’ drop down list, located in the lower toolbar. Select the ‘blank’ and then enter the desired mass. This will automatically be added to the channel table in the Method Set (figure 3).
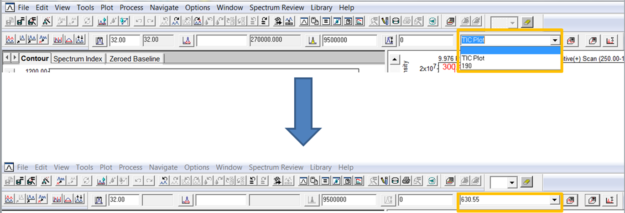
Figure 3
- Integrate the chromatogram for the single mass. The signal to noise for the peak at this mass is now 334.2 (figure 4).
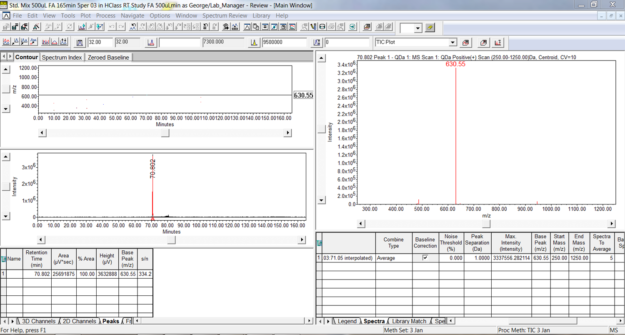
Figure 4
It’s that easy!
ADDITIONAL INFORMATION
Final notes:
- You are not limited to deriving one mass, i.e., you can derive multiple masses so that when you process with the Method Set all masses will be extracted and processed.
- This procedure can be followed using the QuickStart or Pro interface.
- ACQUITY QDa Mass Detector is compatible with the Alliance HPLC system.
id59661, EMP2LIC, EMP2OPT, EMP2SW, EMP3GC, EMP3LIC, EMP3OPT, EMP3SW, EMPGC, EMPGPC, EMPLIC, EMPOWER2, EMPOWER3, EMPSW, SUP