Filtering the Control Chart for certain components - Tip206
Article number: 121095
OBJECTIVE or GOAL
Get Empowered: Empower User Question
Tip #206: Filtering the Control Chart for certain components
The previous tip (Tip #205) explained how to add a Purity Plot to a Report Method.
This tip explains how to filter Control Charts.
ENVIRONMENT
- Empower
PROCEDURE
- In this chromatogram, you have three peaks, two of which have a lower limit set for the USP Plate Count.
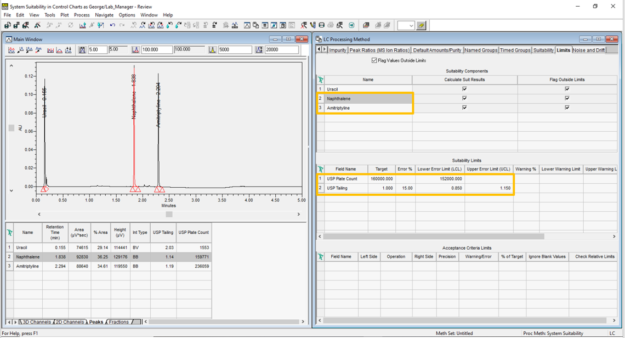
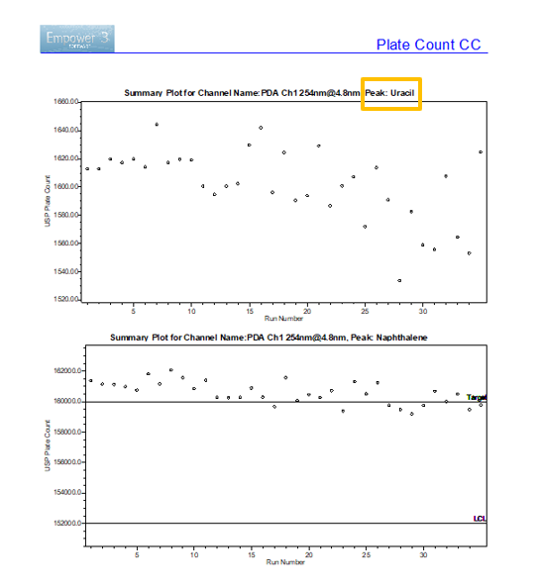
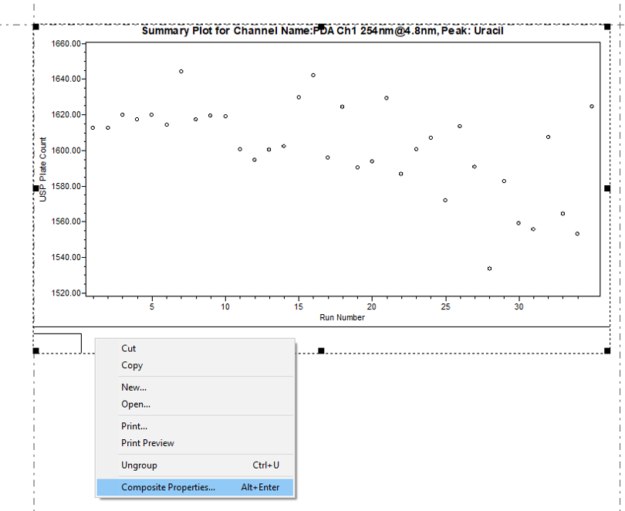
- The Report Method displays a Control Chart for each peak. The Uracil Peak is a "void volume marker", and we want to filter that peak out of the report.
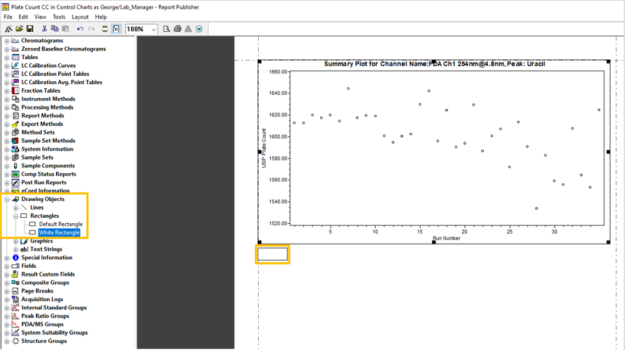
There is no Peak level filtering available in the Summary Plot, but there is a workaround. By creating a composite group that includes the Summary Plot, you enable peak level filtering.
- Expand "Drawing Objects", and then expand "Rectangles". Double-click the white rectangle to add it under the Summary Plot.
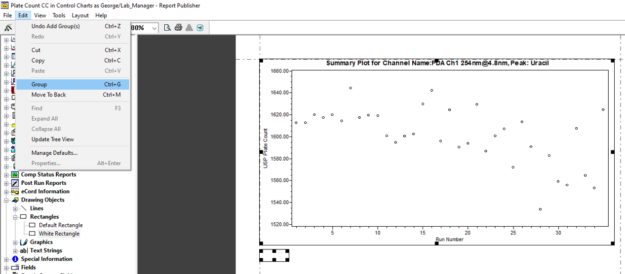
- Control+click both groups, and then, from the Edit menu, select Group.
- Right-click on the composite group and select Composite Properties.
(Alternatively, you can select Composite Properties from the Edit menu.)
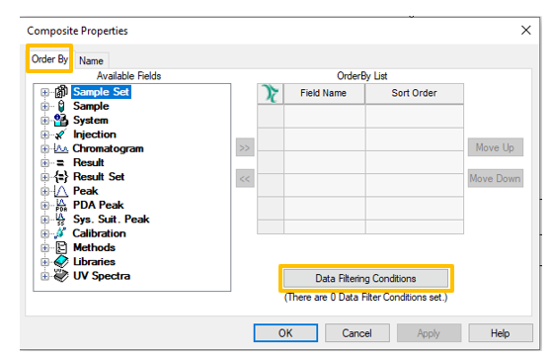
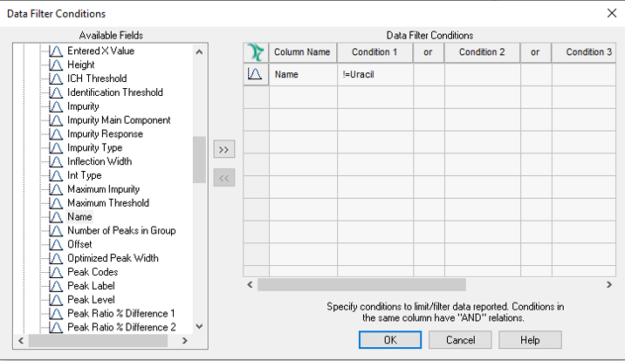
- On the Order By tab, click Data Filtering Conditions.
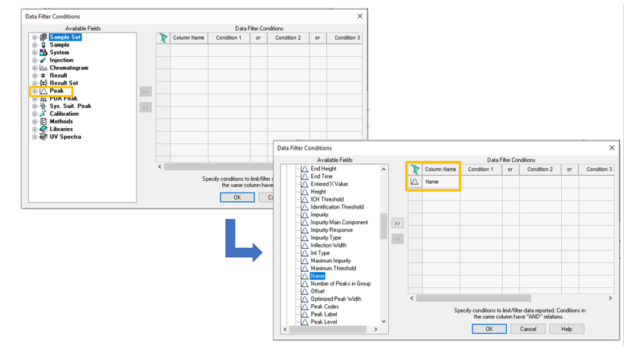
- Expand the "Peak" group, and then double-click on Name.
- Click in the "Condition 1" field, which opens the Create a Condition dialog. Select "Not Equals", type the name of the peak in the field to the right, and click OK.
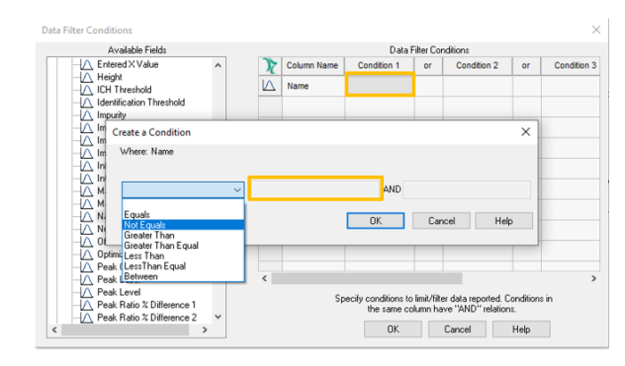
- The Data Filter Conditions are set to filter out the peak with the name "Uracil".
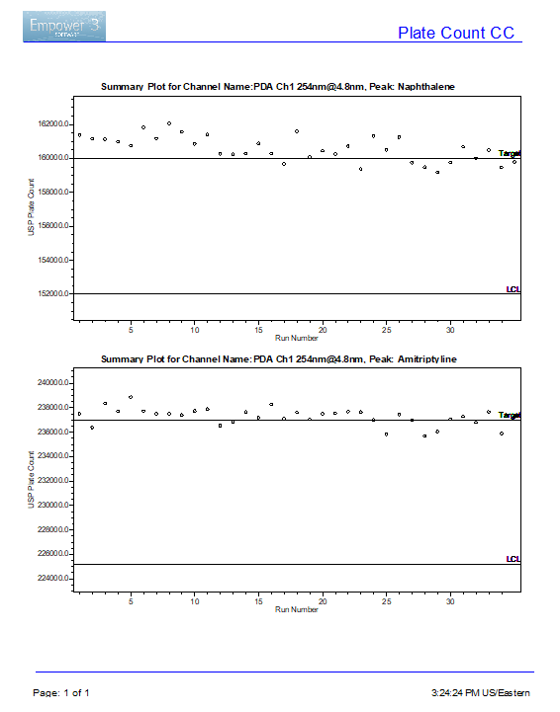
- Click OK to the Data Filter Conditions and the Composite Properties. In Preview, you see the Uracil peak was filtered out of the report and the white rectangle is invisible.
ADDITIONAL INFORMATION
You can use either the Pro or the QuickStart interface for this tip.