Comparing UV Spectra from Different Channels in a Report, at Various Retention Times - Tip204
Article number: 120616
OBJECTIVE or GOAL
Get Empowered: Empower User Question
Tip #204: Comparing UV Spectra from Different Channels in a Report, at Various Retention Times
The previous tip (Tip #203) discussed comparing spectra from different 3D PDA channels at the same retention time.
This tip describes how to report spectra from different 3D PDA channels that are extracted at various retention times. This is achieved by building a library of UV spectra, and then reporting on the library.
ENVIRONMENT
- Empower
PROCEDURE
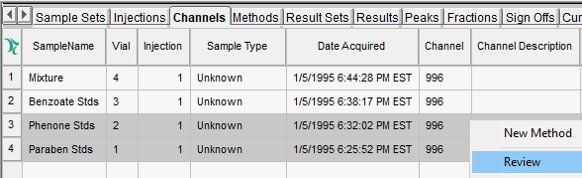
- Right click on the ‘Channels’ of data and select ‘Review’.
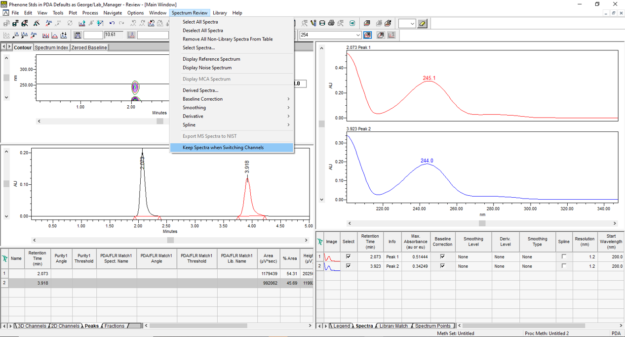
- Extract a chromatogram and either manually integrate the peaks of interest, or use a processing method. From the ‘Spectrum Review’ menu, select ‘Keep Spectra when Switching Channels’.
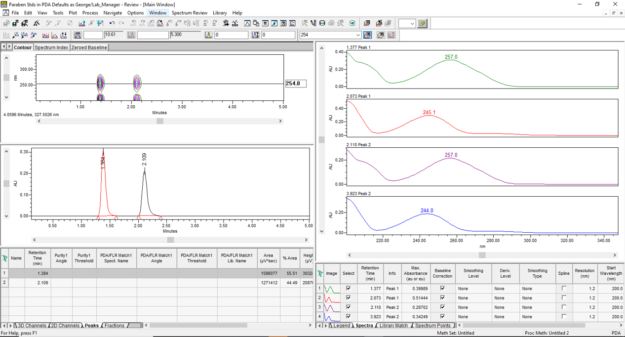
- Go to the next ‘3D channel’, extract a chromatogram, and integrate the peaks.
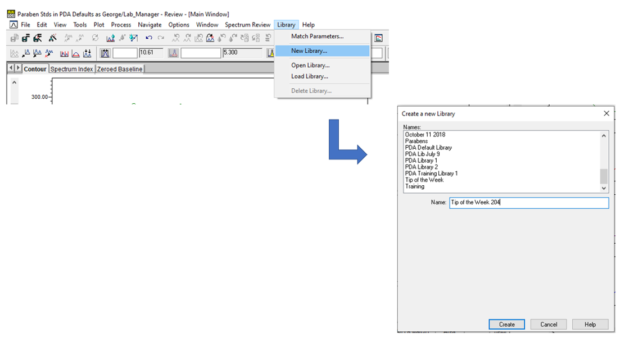
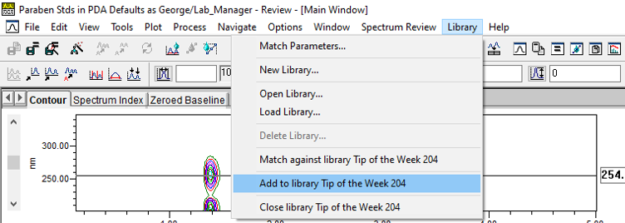
- From the ‘Library’ menu, select ‘New Library’. Enter a name for the library and click ‘Create’.
- To add the spectra to the library, go to the ‘Library’ menu, and select ‘Add to library <library name>’.
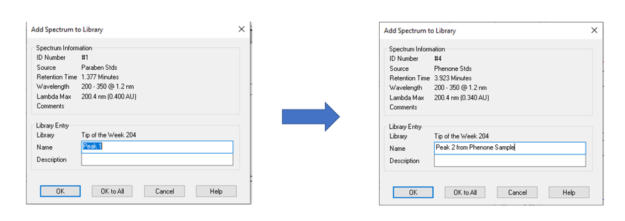
- In the ‘Add Spectrum to Library’ dialogue, enter a name and description and click ‘OK’. Repeat for all spectra and click ‘OK’.
Now the library is created, build the Report Method
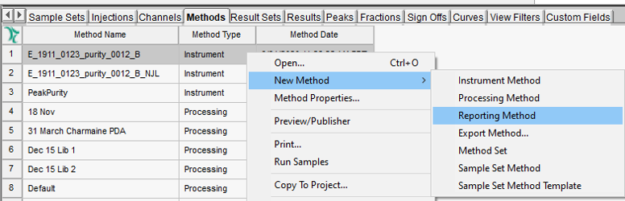
- Go to the ‘Methods’ tab, right click, and select ‘New Method’ > ‘Reporting Method’.
- When Report Publisher opens, click 'Cancel' to dismiss the ‘New Method/Group’ dialogue.
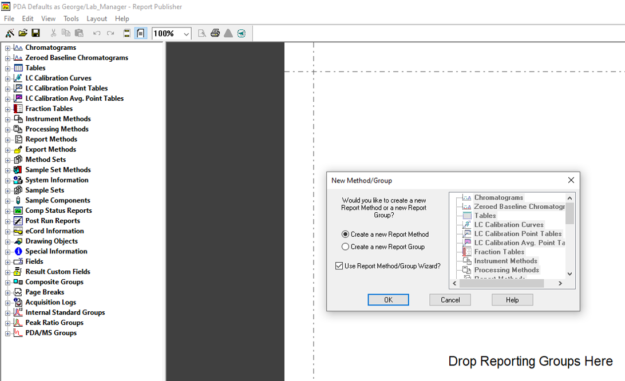
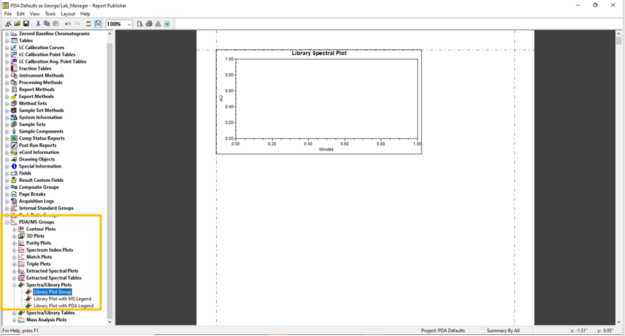
- Expand ‘PDA/MS Groups’, then expand ‘Spectral/Library Plots’, and double click on ‘Library Plot Group’.
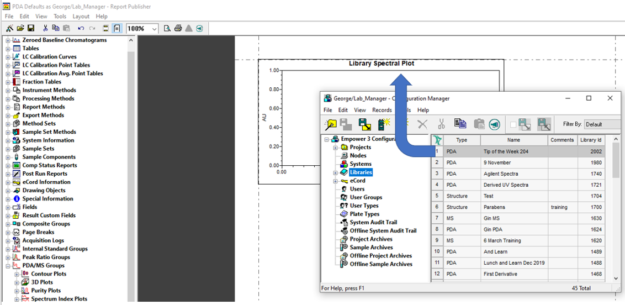
- Open ‘Configuration Manager’, select ‘Libraries’, and size the window so it is on top of the ‘Report Publisher’ window. Click and drag the library from ‘Configuration Manager’ into the ‘Report Publisher’.
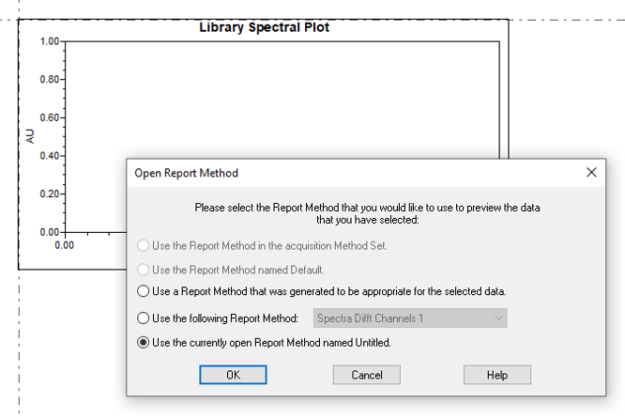
- When the ‘Open Report Method’ dialogue opens, select the last option and click ‘OK’.
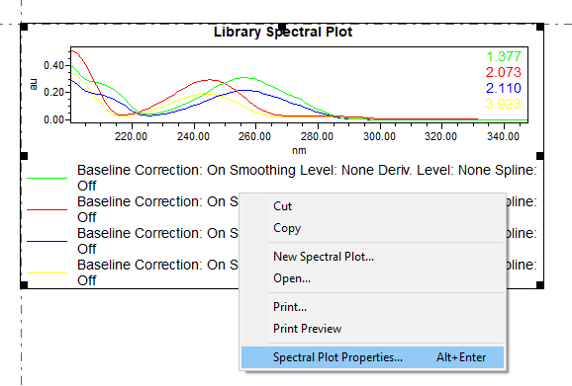
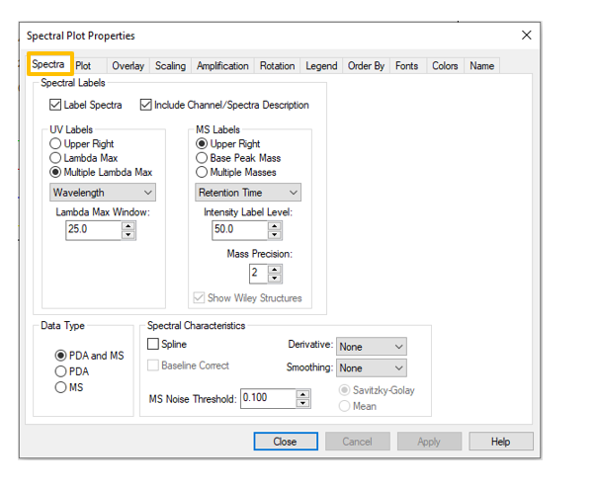
- Close Preview, then right click on the spectral plot, and select ‘Spectral Plot Properties’.
- On the ‘Spectra’ tab, adjust the UV labels.
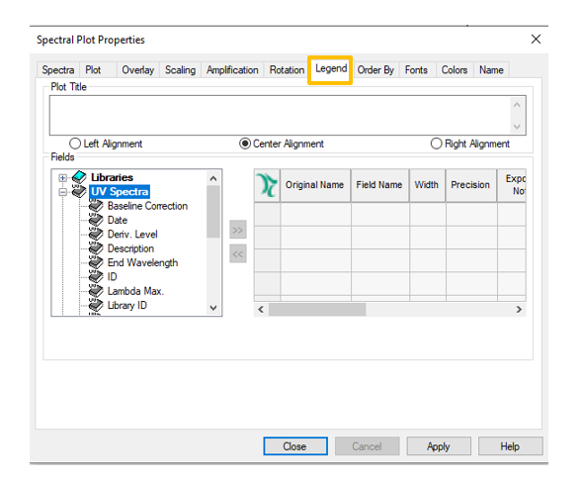
- On the ‘Legend’ tab, expand UV Spectra, and double click ‘Name’.
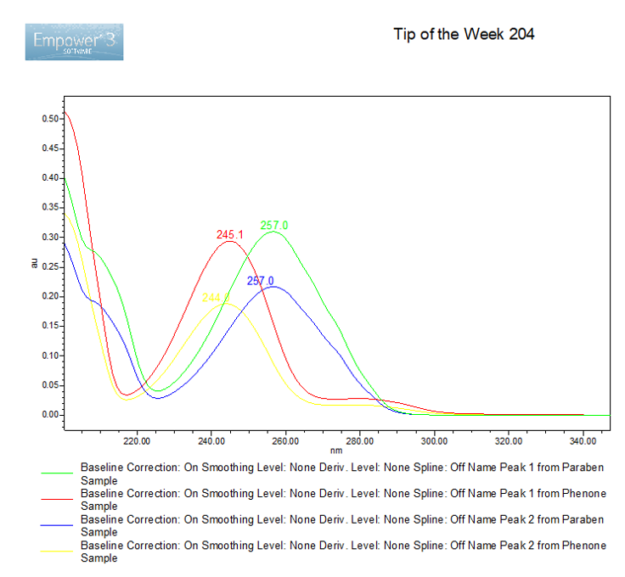
An overlay of the spectra with a legend under the plot is displayed.
ADDITIONAL INFORMATION
You can use either the Pro or QuickStart interface for this tip.