Comparing UV Spectra from Different Channels in a Report, at the Same Retention Time - Tip203
Article number: 120428
OBJECTIVE or GOAL
Get Empowered: Empower User Question
Tip #203: Comparing UV Spectra from Different Channels in a Report, at the Same Retention Time
The previous tip (Tip #202) discussed using the eCord™ with ACQUITY and ACQUITY Arc systems to automate column management and support a control strategy for column usage.
This tip discusses the overlay of UV spectra.
ENVIRONMENT
- Empower
PROCEDURE
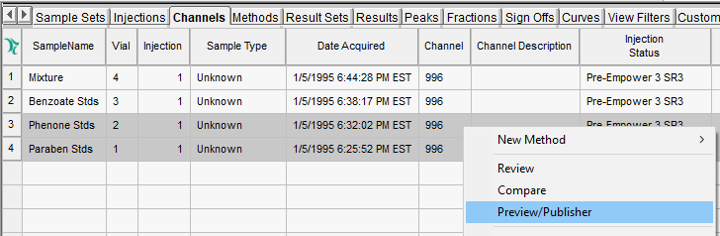
- Highlight the 3D channels, right-click and select Preview/Publisher.
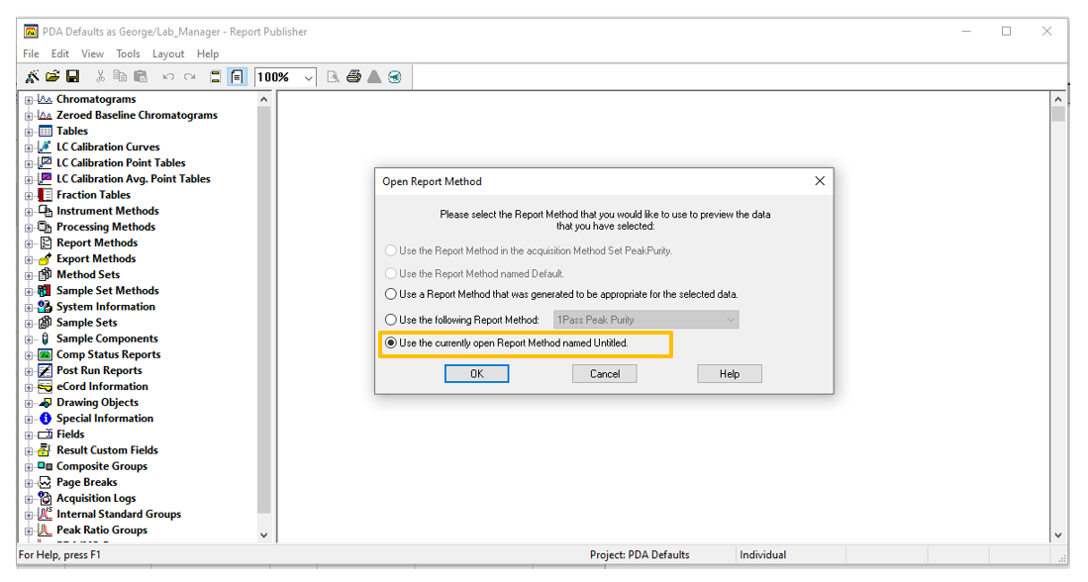
- When the Open Report Method dialog window opens, select "Use the currently opened Report Method named Untitled" and click OK.
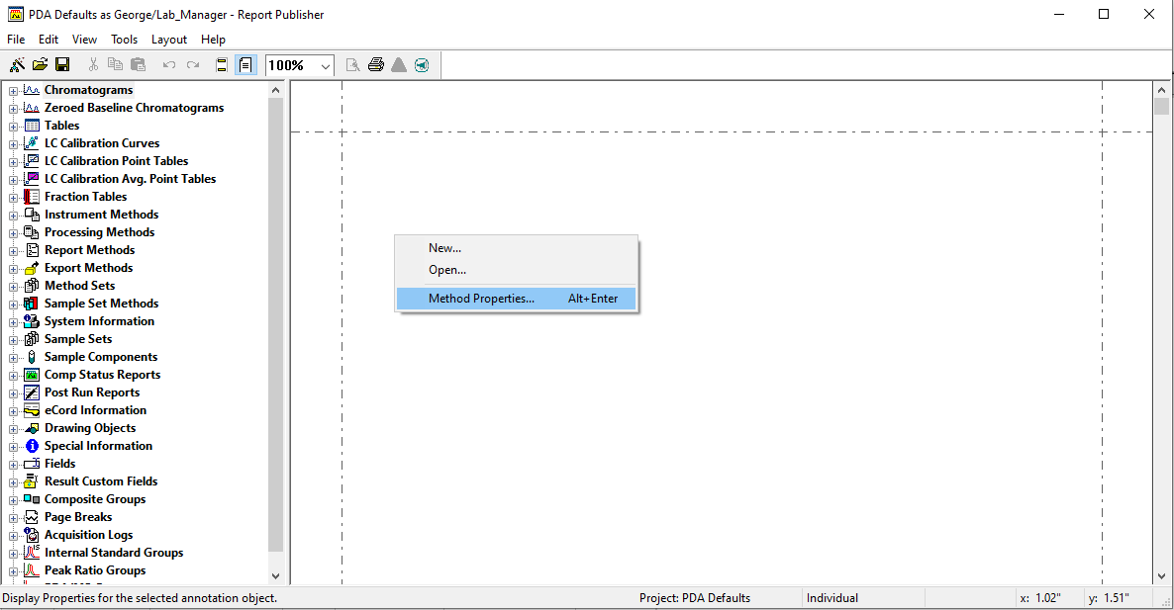
- Right-click in the empty space on the right-hand side of the window and select Method Properties.
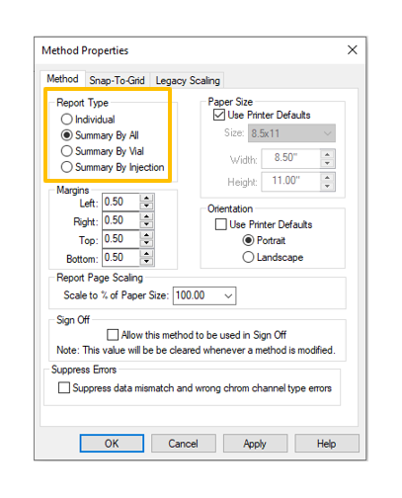
- Under Report Type, select Summary By All and click OK.
- On the left-hand side of the window, expand PDA/MS groups, expand Extracted Spectral Plots, and double-click on the "254nm Extraction Group".
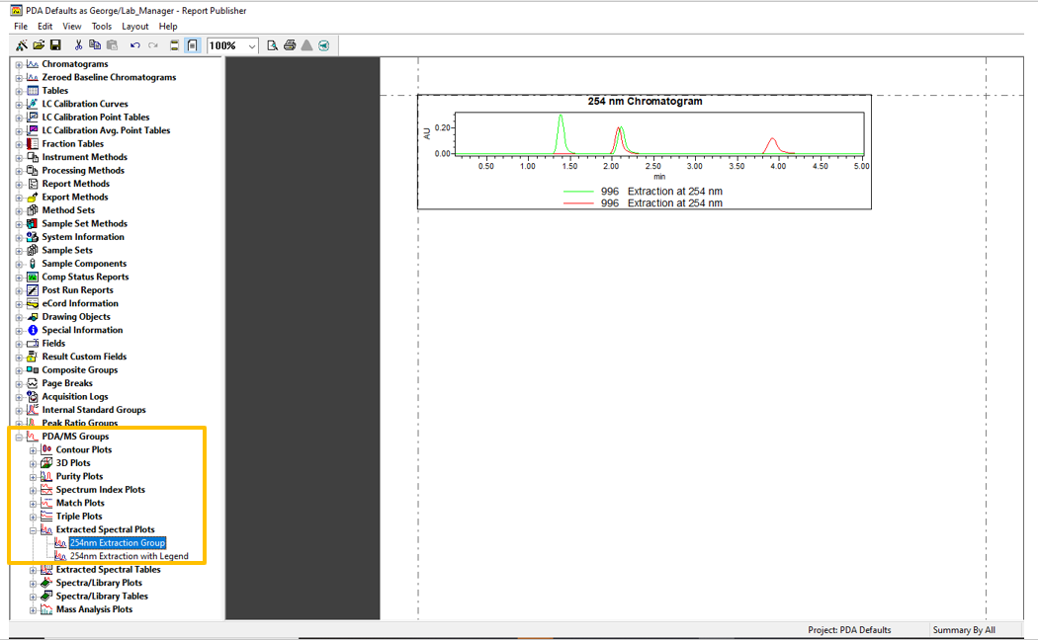
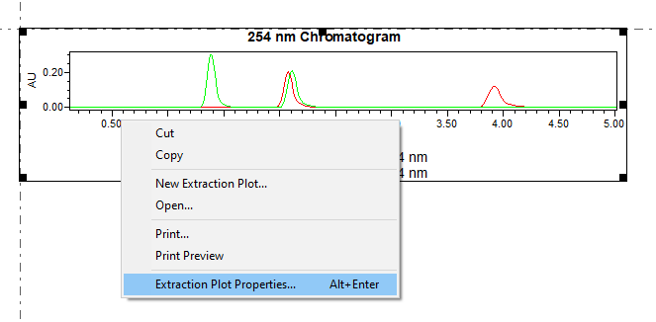
- Right-click on the group and select Extraction Plot Properties.
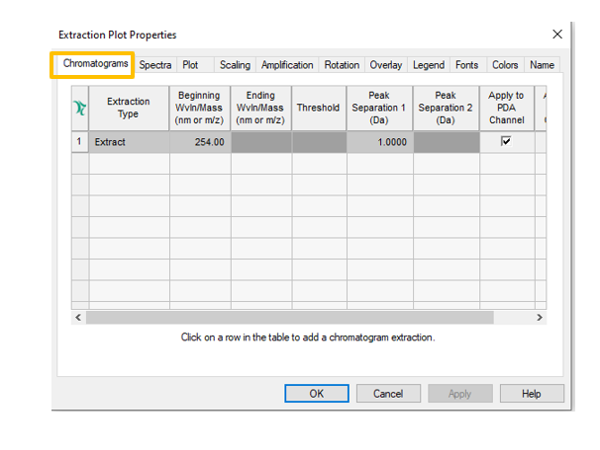
- On the Chromatogram tab, delete line 1.
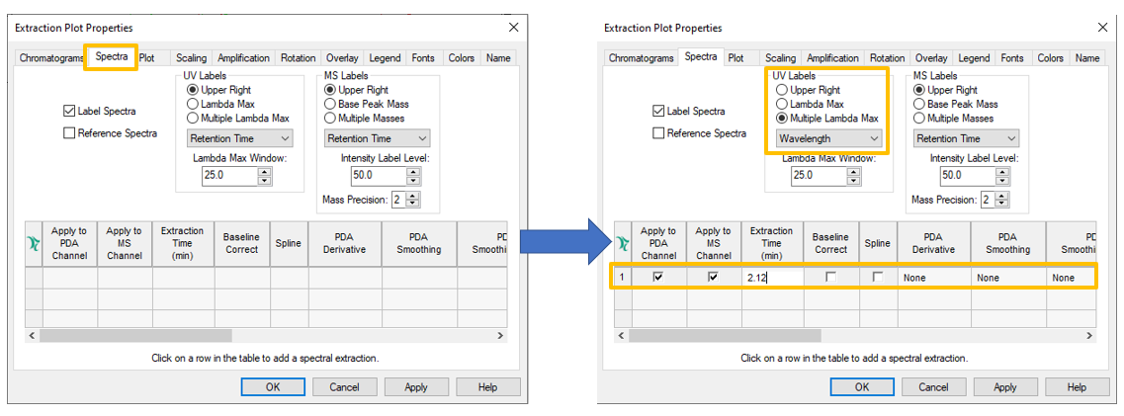
- On the Spectra tab, make the changes as shown in the image below and enter the appropriate extraction time for the spectrum.
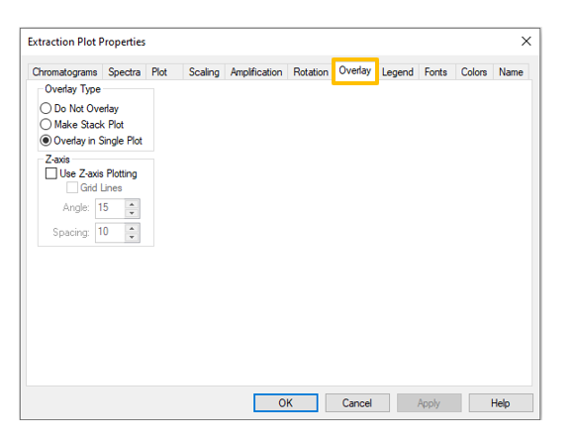
- On the Overlay tab, select "Make Stack Plot" or "Overlay in Single Plot".
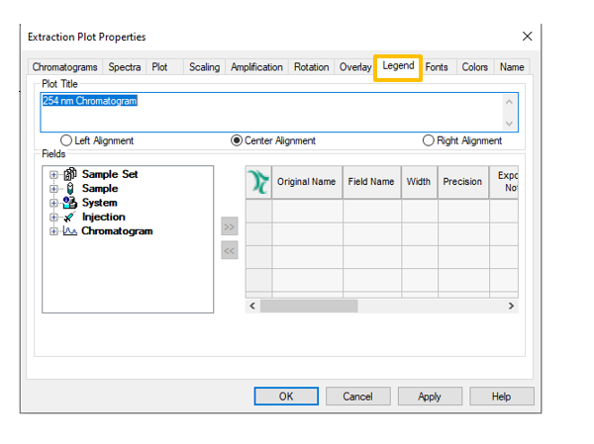
- On the Legend tab, delete the Plot Title entry.
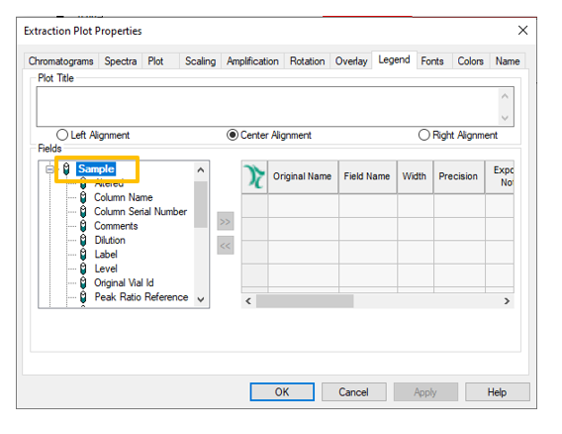
- Expand "Sample".
- Double-click "SampleName".
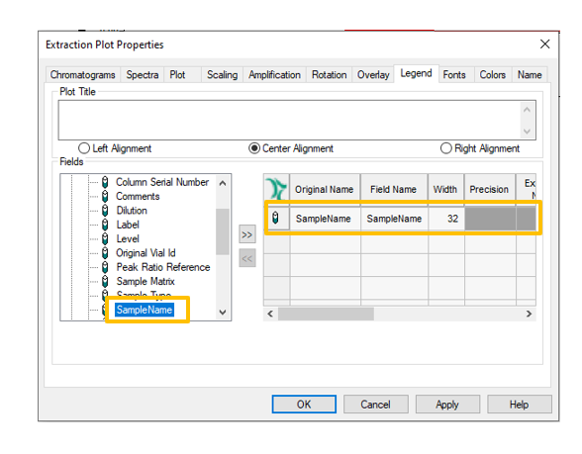
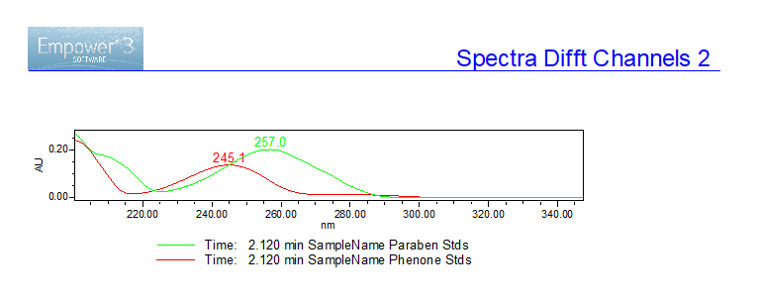
- You now have an overlay of spectra from two different 3D PDA channels at the same retention time.
ADDITIONAL INFORMATION
Final note: You can use either the Pro or QuickStart interface for this tip.
id120428, EMP2LIC, EMP2OPT, EMP2SW, EMP3GC, EMP3LIC, EMP3OPT, EMP3SW, EMPGC, EMPGPC, EMPLIC, EMPOWER2, EMPOWER3, EMPSW, SUP