Setting the Sampling Rate and Time Constant in Empower - Tip207
Article number: 121360
OBJECTIVE or GOAL
Get Empowered: Importance of Sampling Rate and Time Constant for Chromatography
Tip #207: Setting the Sampling Rate and Time Constant in Empower
The previous tip (Tip #206) discussed an Empower user question regarding reports and filtering Control Charts.
This tip describes why Sampling Rate and Time Constant are important for chromatography.
ENVIRONMENT
- Empower
PROCEDURE
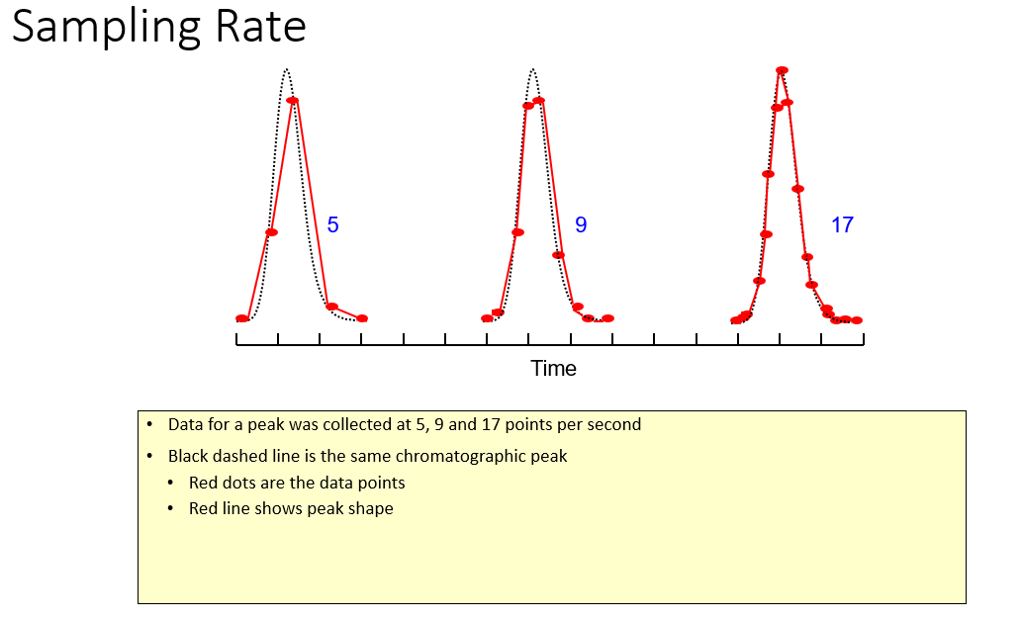
- Let’s illustrate by collecting at different sampling rates. Too few data points result in inconsistency in retention time determination and area calculation for a peak from injection to injection.
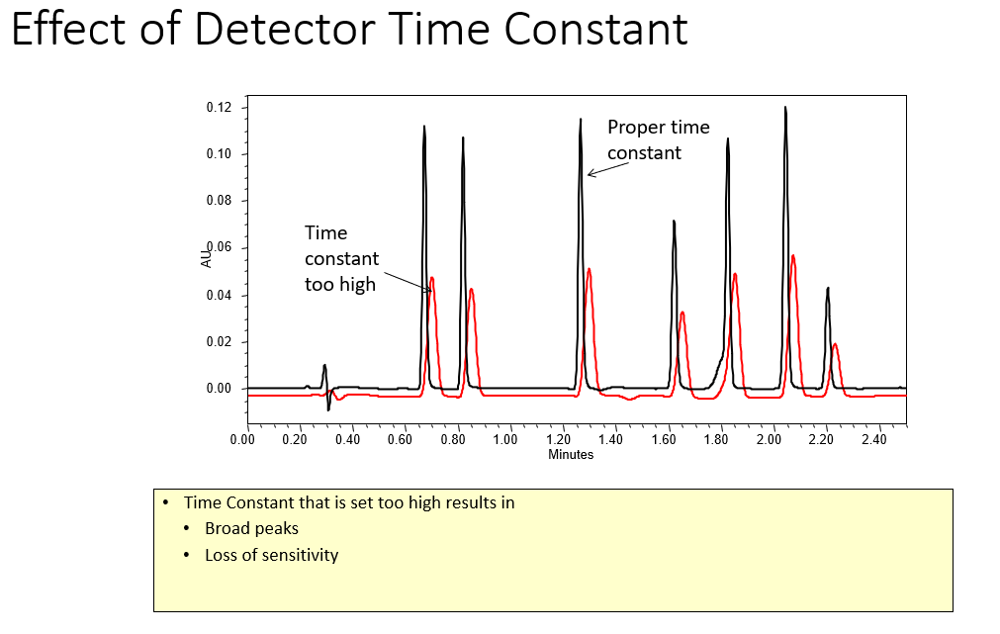
- The Time Constant (or Filter Time Constant) is a noise filter that helps achieve good signal-to-noise ratio by filtering out high-frequency noise. A Time Constant filters data points across the entire chromatogram, so be careful to not use too high of a Time Constant or it will result in distorted peaks. Use the following formula to determine Time Constant: 1/Sampling Rate.
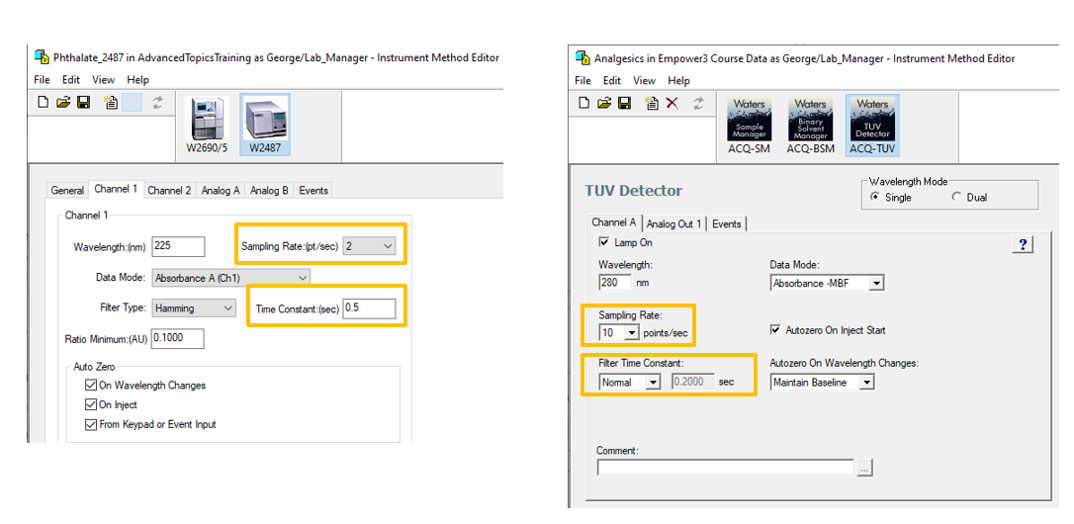
- Both parameters can be found in the detector portion of the instrument method. The following are examples of HPLC and UPLC detectors.
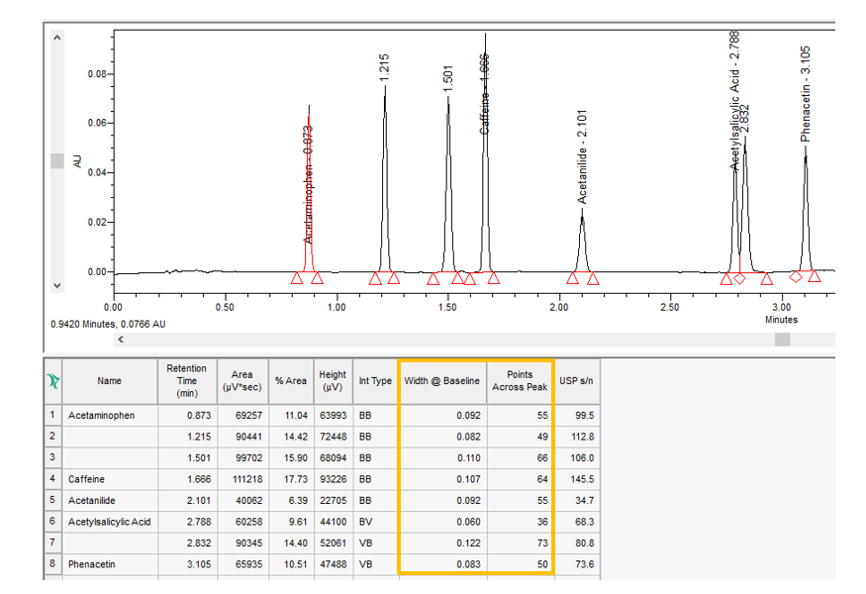
- Adding the Points Across Peak field in the Peaks table within Review will display the number of points for each peak from start to end. Looking at the first peak, we see a width of 0.092 minutes or approximately 5.5 seconds. With a Sampling Rate of 10 points per second, there are 55 points across the peak, more than enough.
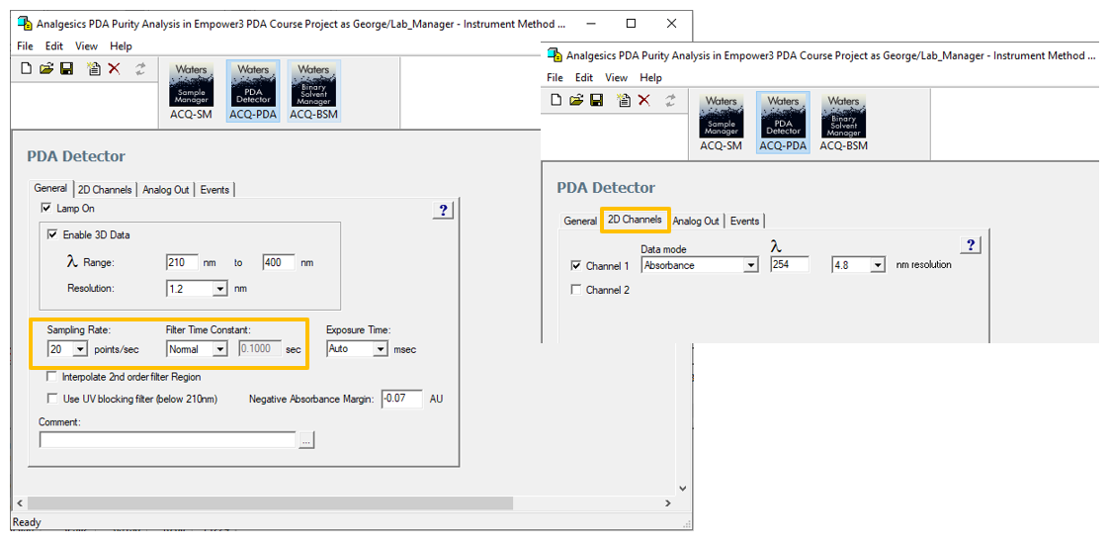
- The same rules apply for extracted chromatograms from 3D PDA data; however, if you want to calculate Peak Purity, you also need a minimum of 12 spectra from peak start to peak end. The Sampling Rate in the PDA instrument method on the General tab will affect both the number of points across the peaks in the extracted 2D chromatograms and the number of spectra across the peak used to calculate Peak Purity. The following is an example of a PDA Instrument Method.
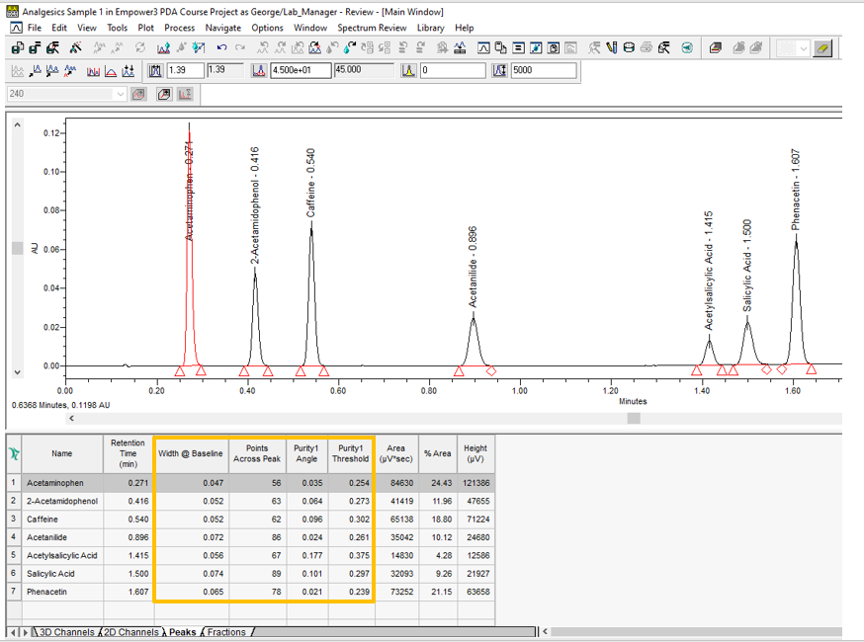
- Looking at the first peak, we see a width of 0.047 minutes or approximately 2.8 seconds. With a Sampling Rate of 20 points per second, there are 56 points across the peak, which is more than enough.
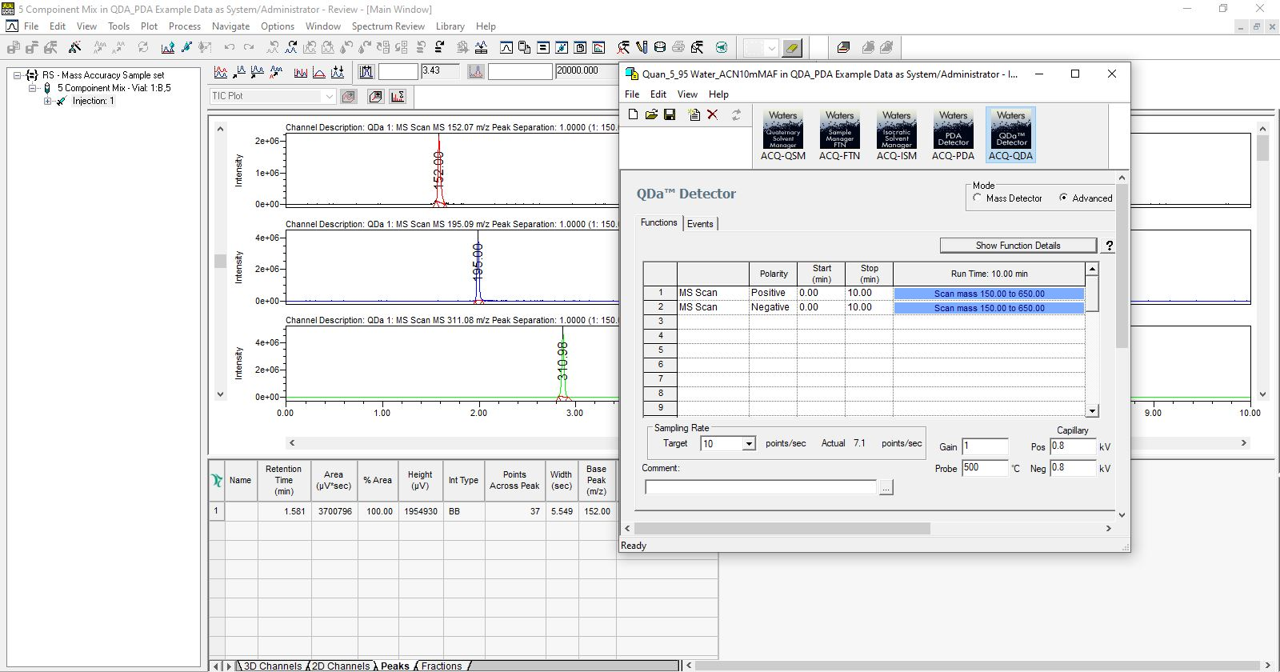
- Mass detectors adjust the sampling rate in the instrument method based on the mass range that you specify. That means for large mass ranges the software automatically adjusts the sampling rate to a lower value – and the reverse is true. For a smaller range it will calculate a higher sampling rate. The following is an example of data collected with an ACQUITY™ QDa™ Mass Detector and its associated instrument method.
ADDITIONAL INFORMATION
Final Note: You can use either the Pro or the QuickStart interface for this tip.