Including the Purity Plot in an Empower report - Tip205
Article number: 122197
OBJECTIVE or GOAL
Get Empowered: Empower User Question
Tip #205: Including the Purity Plot in an Empower Report
The previous tip (Tip #204) explained how to report spectra from different 3D PDA channels.
This tip explains how to include the Purity Plot in an Empower report.
ENVIRONMENT
- Empower
PROCEDURE
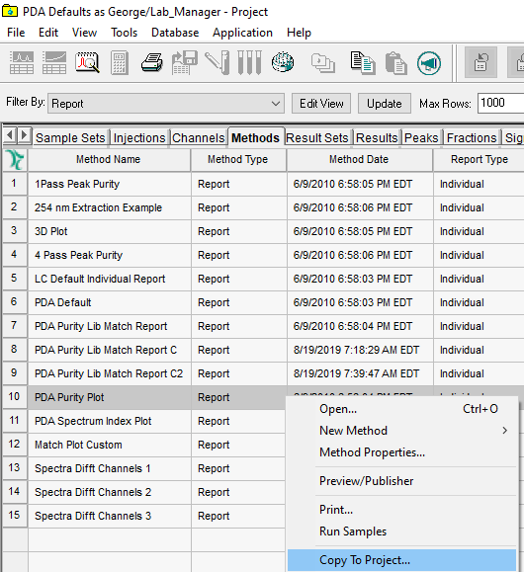
- The PDA Default project, included with Empower, has several Report Methods that you can copy to your working project. One Report Method is "PDA Purity Plot". Right-click on the Report Method and select "Copy to Project".
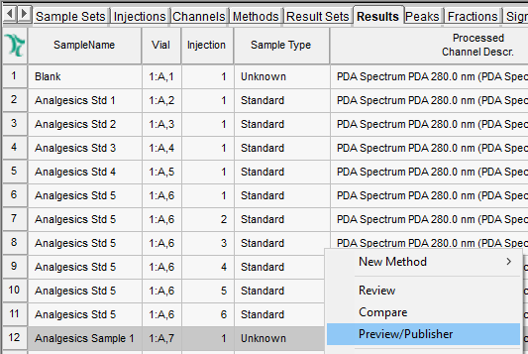
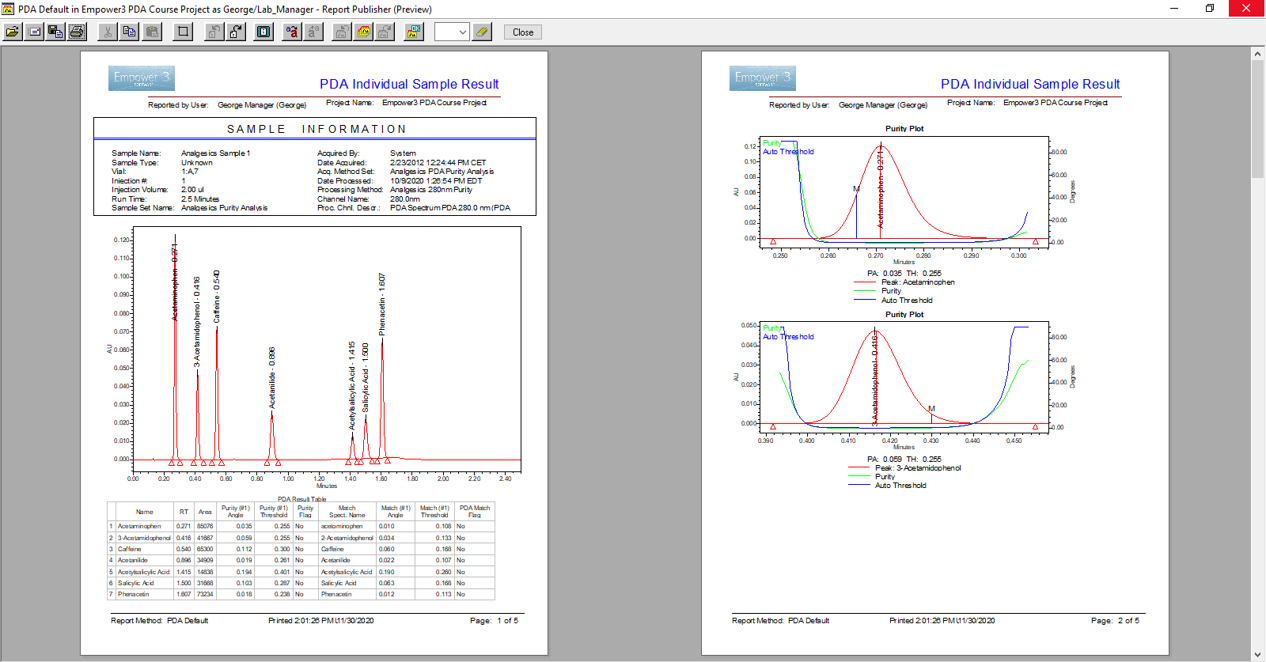
- From your working project, right-click on a result and select "Preview/Publisher".
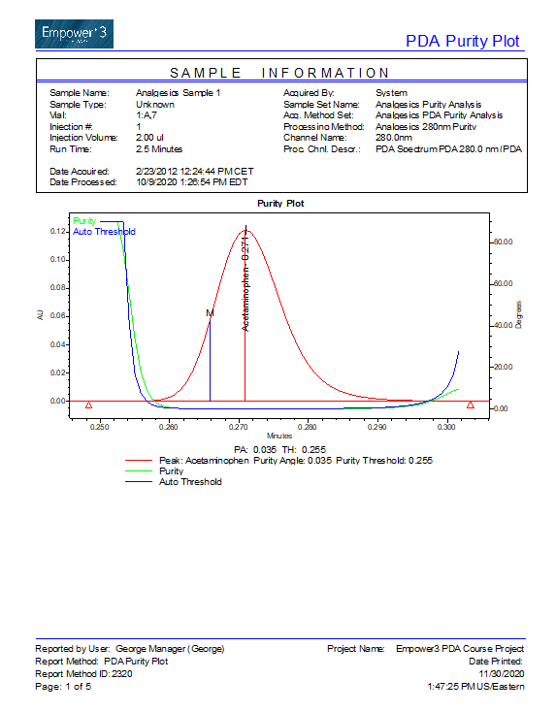
- This Report Method displays a Purity Plot for each integrated peak in the chromatogram.
Adding the Purity Plot to an existing Report Method
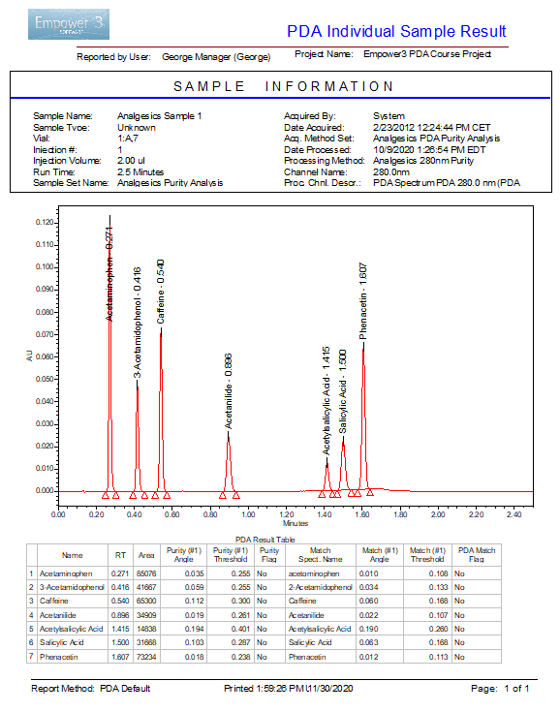
- At this point, you have a typical report with a chromatogram and peak results, including "Purity Angle" and "Purity Threshold".
- In the Report Publisher window, expand PDA/MS Groups and then Purity Plots. Either double-click or drag-and-drop the "Purity Plot" group into the report.
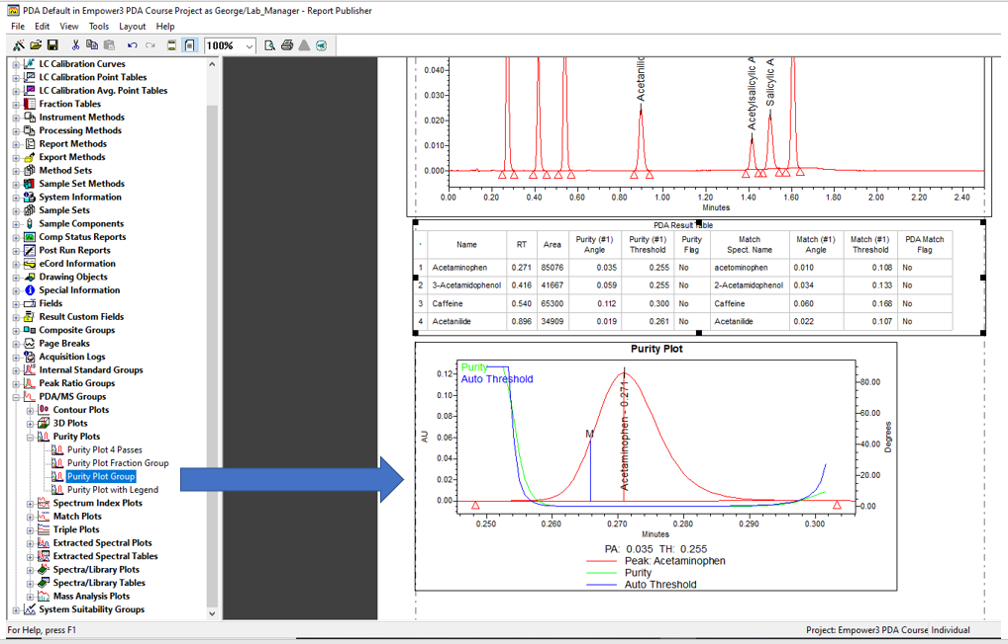
- The report now contains the chromatogram, peak table, and Purity Plot for every integrated peak.
ADDITIONAL INFORMATION
You can use either the Pro or the QuickStart interface for this tip.