How to calculate an ion ratio in TrendPlot - WKB63738
Article number: 63738
OBJECTIVE or GOAL
Plot an Ion Ratio graph in TrendPlot.
ENVIRONMENT
- MassLynx
- TargetLynx
- TrendPlot
PROCEDURE
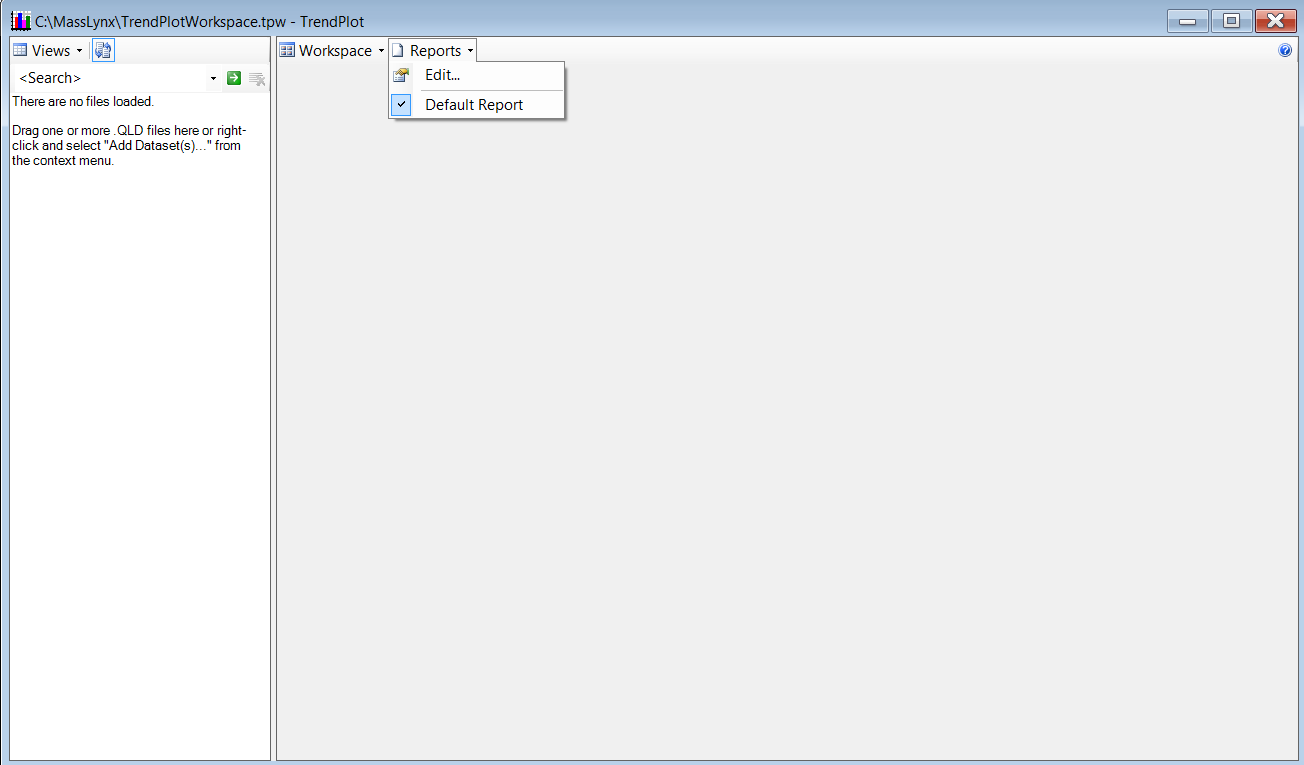
- Click on the TrendPlot icon in the TargetLynx sidebar in MassLynx.
- Open the Report Editor by clicking Reports > Edit.
- Follow the procedure for editing a TrendPlot graph. For more information, consult the Help file in MassLynx and search for "TrendPlot Template". You can also use the instructions in the attached file.
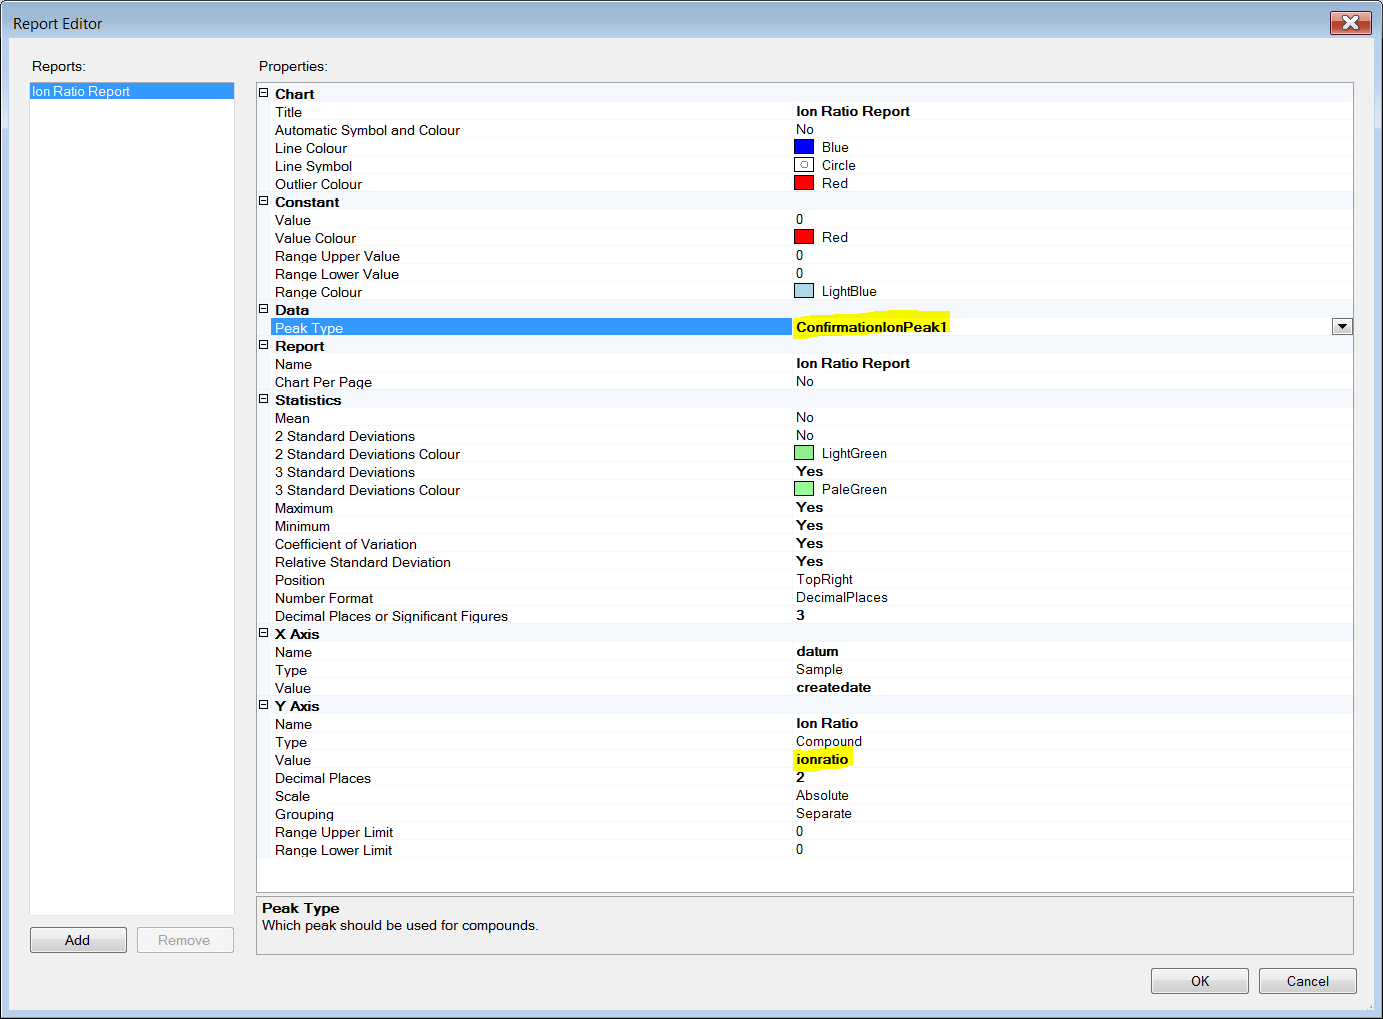
- Under Data, select the ConfirmationIonPeak1 option instead of the default setting Peak. For the 2nd, 3rd, or 4th Ion Ratio, select the corresponding "ConfirmationIonPeak2-4".
- Under Y Axis > Value, select ionratio.
ADDITIONAL INFORMATION