How to Use Molecular Weight Markers found on the Slicing tab of the Processing Method - Tip132
Article number: 72501
OBJECTIVE or GOAL
Welcome back to Get Empowered! In the last Empower tip-of-the-week post for Empower Chromatography Data Software, we completed the discussion on using Custom Fields when working with polymers (Tip #131).
In this week’s tip, we are going to discuss the use of Molecular Weight Markers found on the Slicing tab of the Processing Method. Customers that manufacture polymers report data needed for premanufacture notification submission which includes low value exemption. This includes the reporting of the percentage of the polymer below a specified molecular weight. This is easily accomplished by using Molecular Weight Markers.
Let’s get started.
ENVIRONMENT
- Empower
PROCEDURE
- On the Slicing tab in the Processing Method, view six Molecular Weight Markers. Molecular Weight markers 1 thru 3 are used to calculate the percent area of the molecular weight distribution ‘above’ a molecular weight. Markers 4 thru 6 are used to calculate the percent area of the molecular weight distribution ‘below’ a molecular weight. In this example, I’ve entered 20000 for Molecular Weight Marker 4.

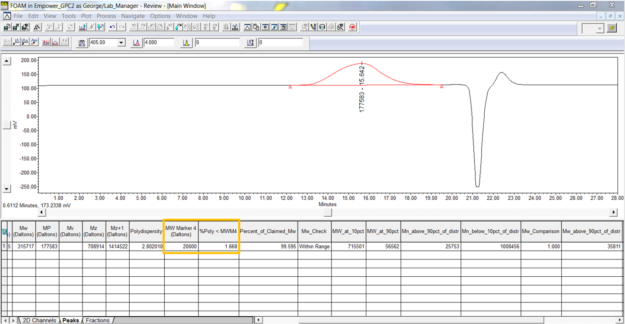
- Once the data is processed, you can view the Molecular Weight Marker value and the percent of the polymer below the molecular weight in the Peaks table in Review.
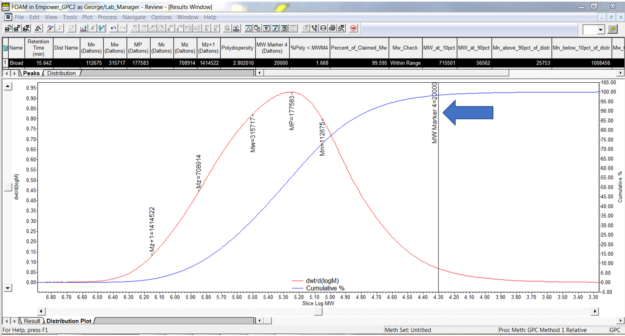
- The molecular weight distribution plot can display any Molecular Weight Markers that have been added by turning on Molecular Weight Markers in the options of the plot.
It’s that easy!
ADDITIONAL INFORMATION
- This procedure can be followed using the QuickStart or Pro interface.