How to Use MS 3D subtraction to remove background interference - Tip111
OBJECTIVE or GOAL
Welcome back to Get Empowered! In the last Empower tip-of-the-week post for Empower Chromatography Data Software, we learned about using CODA (component detection algorithm) as a tool when scouting for peaks. (Tip #110).
This week, we will learn about MS 3D Subtraction. If your QDa detector becomes contaminated by something like polyethylene glycol, this can interfere with all the MS spectra in your sample. Using the MS 3D Subtraction in the Processing Method, you can subtract a background spectrum to eliminate the interference.
Let’s get started.
ENVIRONMENT
- Empower
PROCEDURE
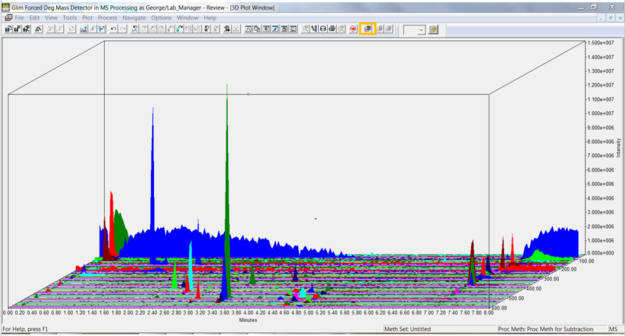
- We start by looking at a TIC plot for a 3D MS channel in Review.
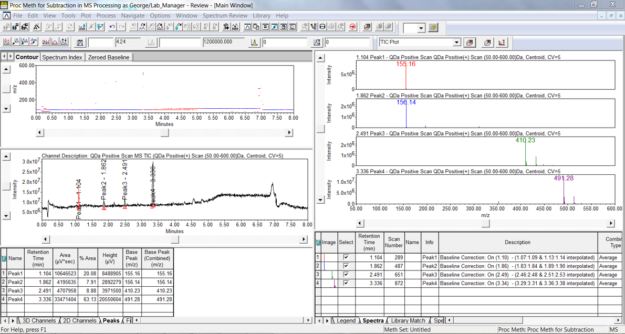
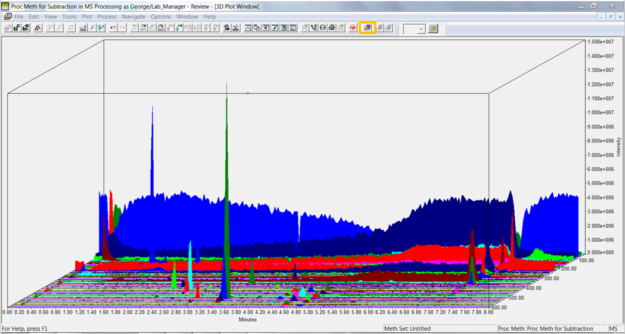
-
Click the 3D Plot tool in the tool bar or select 3D Plot from the Window menu. The plot displays time on the x-axis, intensity on the y-axis, and mass on the z-axis. Note the high intensity at the low mass end highlighted in blue.
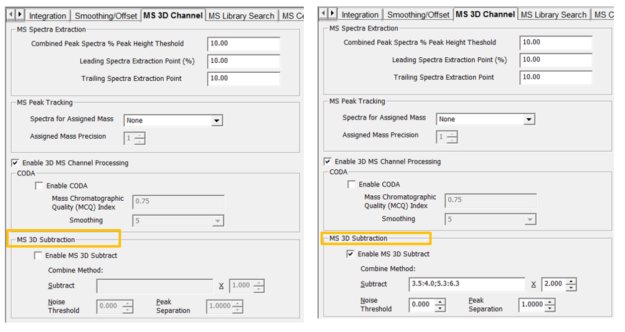
- On the MS 3D Channel tab in the Processing Method, we can enable the MS 3D Subtraction. Let’s look at the parameters.
- Identify an area(s) of the baseline without peaks which can be used for the subtraction. Tick the ‘Enable MS 3D Subtract box’ and enter a time range or ranges in the Subtract field. A time range is entered using the: between times and a ; separating more than one range. Empower will calculate an average spectrum based on the times entered which will be subtracted from everything else.
- Specify a ‘value’ which to multiply the spectrum by before performing the subtraction.
- Specify a ‘noise threshold’ which will remove data points with intensities below the threshold. This value is entered as a percentage of the base peak intensity.
- Empower uses Peak Separation to combine data points within the range to produce a single mass. For example, if you specify a value of 2 then all masses from 299 to 301 are combined into a single mass of 300.
- Return to the Main Window and reintegrate the chromatogram. From the 2D channels tab select the channel which resulted from the subtraction and overlay it with the original TIC plot. Note the change in the baseline and the peaks between 4.2 and 5 minutes.
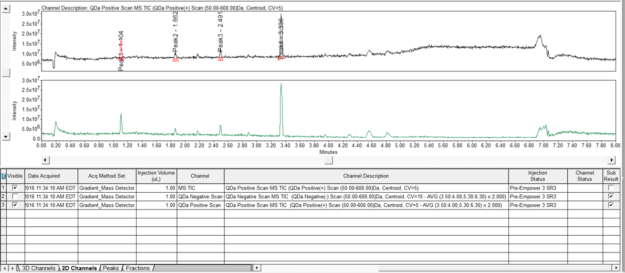
- Select the chromatogram with the baseline subtraction by highlighting it in the 2D channels tab and click the 3D Plot tool. Notice the intensity at the low mass range has been reduced.
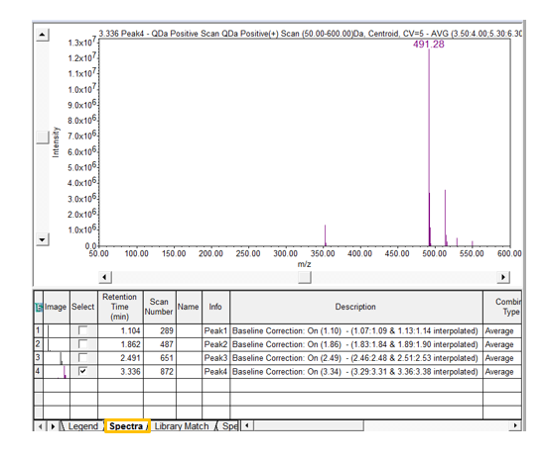
- Return to the Processing Method and enter a value for the Noise Threshold. Reintegrate the chromatogram in the Main Window. From the Spectra table under the Spectrum Review window, deselect all but 1 spectrum.
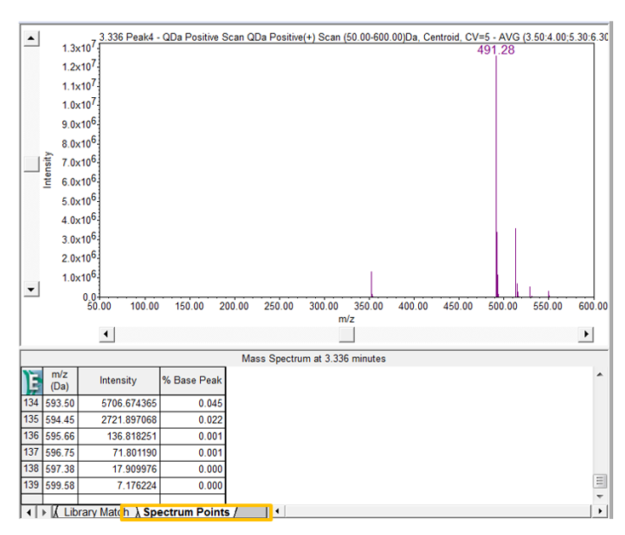
- Click the Spectrum Points tab to view each point of the spectrum with its mass and intensity. If you compare the point table before and after the use of the Noise Threshold you will observe a difference in the number of points.
It’s that easy!
ADDITIONAL INFORMATION
- You can perform 3D subtraction using a Derived Channel as well. Why use the function in the Processing Method versus the Derived Channel? If you want to process all data in the same fashion, I would use the Processing Method. If you want to process data with the same Processing Method but vary the region of the chromatogram for subtraction, I would use the Derived Channel.
- This procedure can be followed using the QuickStart or Pro interface.
- ACQUITY QDa Mass Detector is compatible with the Alliance HPLC system.
id68299, EMP2LIC, EMP2OPT, EMP2SW, EMP3GC, EMP3LIC, EMP3OPT, EMP3SW, EMPGC, EMPGPC, EMPLIC, EMPOWER2, EMPOWER3, EMPSW, SUP