QDa MS Data in Empower - MS Peak Tracking - Tip362
OBJECTIVE or GOAL
How to track MS Peaks
ENVIRONMENT
- Empower
- Empower Tip of the Week #362
PROCEDURE
A typical reversed phase method development scenario might include trying different columns and varying the strong solvent for the mobile phase. The challenge is tracking the peaks from experiment to experiment. We could build a library of UV spectra for our compounds of interest with a PDA and then have Empower match the apex spectrum of each peak to the spectra in the library. That works well if the UV spectra are sufficiently different for the compounds of interest. An alternate approach would be to track the peaks by m/z ratio using the QDa Mass Detector. We can easily summarize peak tracking using Assigned Mass.
Let’s see how it’s done!
STEP 1
On the MS 3D Channel tab of the Processing Method, MS Peak Tracking is enabled by first selecting Apex or Combined from the Spectra for Assigned Mass drop-down list (figure 1). (Refer to Tip 360 for an explanation of Combined)

STEP 2
Set the desired precision (figure 2).

STEP 3
Save the changes to the Processing Method and process the Sample Set. Create a Summary By All Report Method that includes the Peak Track Component Summary table (figure 3).

STEP 4
This summarizes the peaks by Assigned Mass which is a text field. We can track our peaks as we vary the chromatographic conditions. For example, we see mass 182 and the retention time for the peak with that mass over 8 experiments (figure 4).

STEP 5
Now let’s look at the Result Set. In this result, we see the Assigned Mass, Assigned Mass Value, and the Notes fields have been added to the Peaks table (figure 5). The Base Peak value from either the Apex spectrum or the Combined Spectrum is then copied into the Assigned Mass Value field using the precision set in the Processing Method. (Base Peak and Assigned Mass Value are both numerical fields.)

STEP 6
In this result, we see that peaks 6 & 7 are fused and have the same Assigned Mass. Empower has appended these Assigned Masses with numbers (figure 6). Now let’s evaluate the assignment.

STEP 7
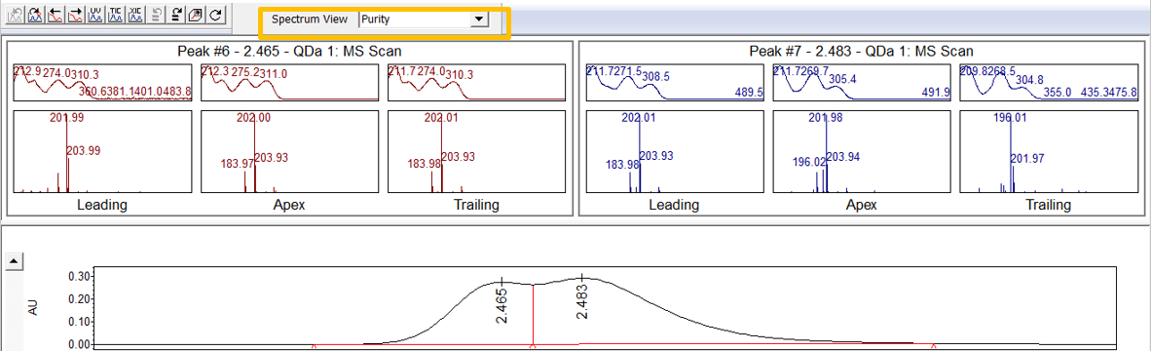
In the Mass Analysis window, we look at the Purity View for these two peaks. (Refer to Tip 360 for an explanation of Purity view). We may decide that the peak at 2.483 minutes has a mass of 196 and that the 202 comes from the peak at 2.465 minutes (figure 7).
STEP 8
Back in the main window, right-click on the row for the peak 2.483 minutes and select Modify Assigned Mass (figure 8).

STEP 9
Enter the mass and any notes, then click OK (figure 9).

STEP 10
The peak table has been updated (figure 10). Save the result.

STEP 11
Summarizing the Result Set once again, we see the new summary which includes the manual assignment (figure 11).

ADDITIONAL INFORMATION
For more detailed information and to learn more, view Application Note: Streamline Method Development with Empower 3 MS Peak Tracking.