waters_connect System Monitoring - System Monitoring Dashboard - Tip335
OBJECTIVE or GOAL
Search and view the Empower-controlled systems in the System Monitoring dashboard.
ENVIRONMENT
- Empower
- Empower Tip of the Week #335
PROCEDURE
STEP 1
To view systems with a common status in the System Monitoring dashboard, select a status or multiple statuses. In this example, the Running and Idle systems were selected. As a result, it shows 12 out of the 16 total systems in the dashboard (Figure 1).

STEP 2
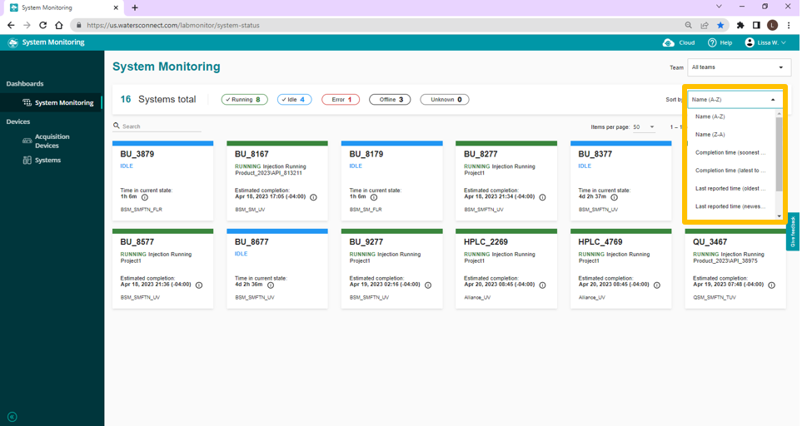
You can sort the tiles in different orders using a name, completion time, and last reported time (Figure 2).
STEP 3
Teams can be created to allow selected systems to be grouped together. This provides users who are members of the same team the ability to view the systems and acquisition devices. In this example, the Wilmslow-Demo-Lab team was selected, so only three systems appear in the dashboard view (Figure 3).

STEP 4
Use the Search field with information about the system you need to find. As an example, “BU_81” is specified in the search bar, and the result shows three systems that have similar names. There is no need to use a wildcard (Figure 4).

STEP 5:
Using the Search field does not limit the search to the system name. It also searches across the System comments and the individual component types. As an example, “tuv” is specified in the search bar, and the result shows nine systems (Figure 5).

Among them, one system has TUV in the system name, “APC_ELSD_TUV”. Another has TUV in the system comment, “QSM_SMFTN_TUV”. All others have TUV (not shown) as part of the individual components of the chromatographic system.
STEP 6
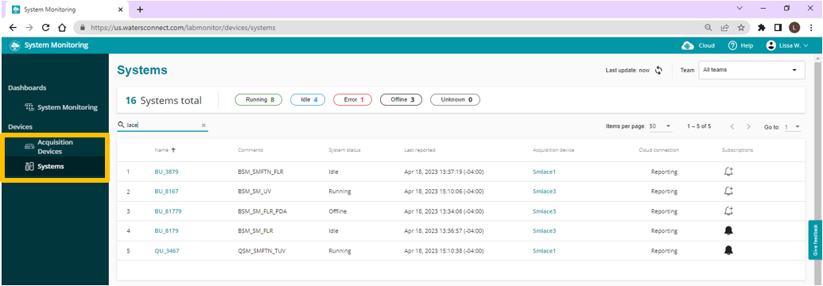
The same technique used in STEP 4 can be applied to the Acquisition Devices list or the System List accessed through the panel on the left (Figure 6).
ADDITIONAL INFORMATION
For more information, visit www.waters.com/systemmonitoring or contact your Waters Informatics Sales Specialist.