waters_connect System Monitoring: View System History - Tip336
OBJECTIVE or GOAL
View System History in waters_connect System Monitoring.
ENVIRONMENT
- Empower
- Empower Tip of the Week #336
PROCEDURE
STEP 1
To view System History in the System Monitoring dashboard, search for the system you are interested in. In this example, we selected System BU_8167 (Figure 1).

STEP 2
From the System Details screen, view the current status as highlighted in the middle of the screen (Figure 2). This section shows the last sample set run and, if currently running, how long before it is completed.

STEP 3
In the bottom section of the screen, note the Recent History of the system. This is a default view that shows you the history for the past 7 days (Figure 3).

STEP 4
To change the Recent History view, click on the System History tab (in the upper-left corner) or on the "View more details" link (in the lower-right) (Figure 4).

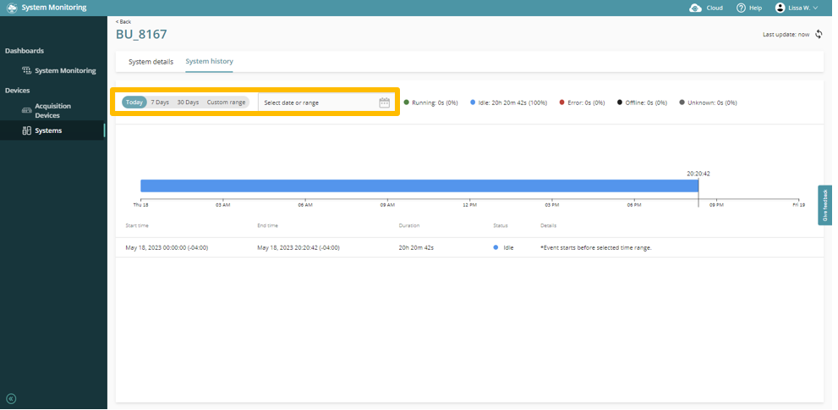
STEP 5
From the System History screen, you will see the system history default for one day (Today) status view. To change the System History, select other date tabs, such as 30 days, or even the Custom range to define a different date range (Figure 5).
STEP 6
In this example, 30 Days is selected (Figure 6). As highlighted, view the total metrics of how much time (and percentage) the system maintained a certain status. Note: running metrics include not just when injections were collected but also the time when the system was in equilibrate, column conditioning, or pause, as long as these non-injection functions are selected as part of the sample set method.

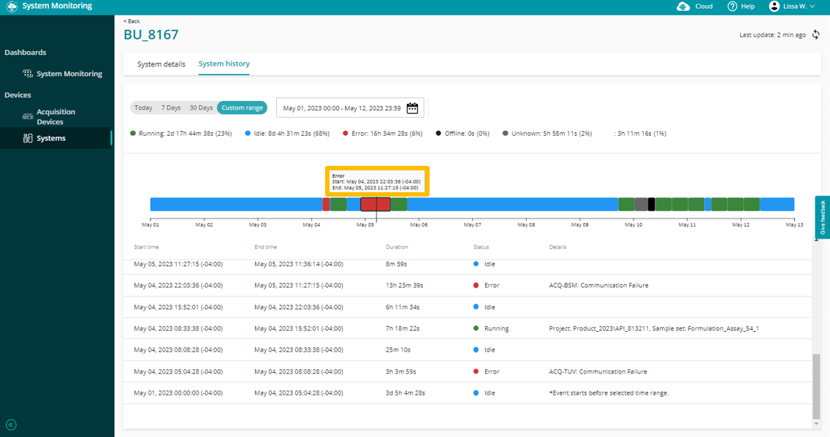
STEP 7
The middle and bottom sections of the System History tab show a graphical timeline and a tabular timeline of the system status during the time period selected, in this case a Custom range (Figure 7). Details on the tabular timeline include the project and sample set when the system is running. Or, when the system has an error, the details include the error reported.

STEP 8
Pointing to a segment of the graphical timeline provides the start and end times of that status (Figure 8). Note: when viewing a section with an error, the error may not be for the full duration; it may be that the status persists in the error state until someone fixes the problem.
ADDITIONAL INFORMATION
For more information, visit www.waters.com/systemmonitoring or contact your Waters Informatics Sales Specialist.