waters connect™ System Monitoring - Getting Started - Tip334
OBJECTIVE or GOAL
Real-time Lab Management of Your Empower Controlled Systems
ENVIRONMENT
- Empower
- Empower Tip of the Week #334
PROCEDURE
The waters_connect System Monitoring is a holistic approach to real-time lab management. It allows you to see which instruments in your Empower system are running, available for use, or in an error state. It provides a faster response to address errors and a way to assess instrument utilization.
NOTE: This is a Software as a Service (SAAS) application that is available via our waters_connect cloud platform.
STEP 1
Prior to accessing waters_connect System Monitoring, a new account is required for each user. This account is typically set up by your software administrator. A welcome e-mail is sent to you with a URL to access the waters_connect Cloud platform. You will be prompted to set your own password as part of this process.
STEP 2
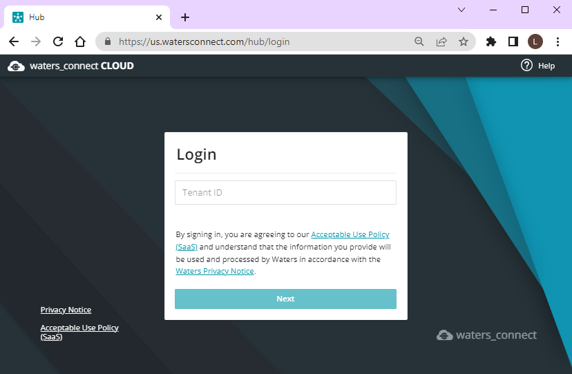
The link sent to you within the welcome email takes you to the tenancy selection. The unique ID for your company will already be entered here. Click Next (figure 1).
STEP 3
Enter the Username and Password then click Sign In (figure 2).

STEP 4
The waters_connect Cloud page opens (figure 3).
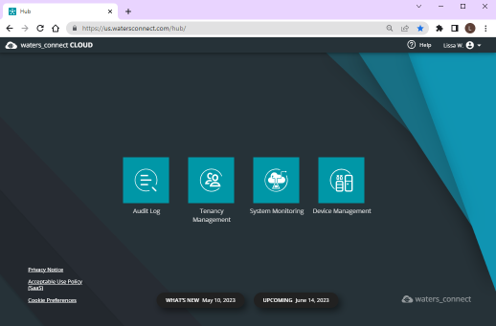
You can view details of What’s New, such as recent updates to the product, in the notation below (figure 4).

You can view details of upcoming releases as you select Upcoming (figure 5).

STEP 5
Click on the System Monitoring tile (figure 6).

This brings you to the System Monitoring Dashboard (figure 7).

STEP 6
On each tile, the System name and its real-time status will be displayed. Status is shown in one of 4 different colors:
- Green for running: When running, it will identify the project into which data is being collected and the time of completion for the last injection of the last queued sample set.
- Blue for idle: When idle, it will show how long it has been in that state.
- Red for error: When error, it will identify the error and show how long it has been in that state.
- Black for offline or unknown. When offline or unknown, it will show how long it has been in that state.
STEP 7
If you click on any system tile, it will provide more details regarding the components of the system, the specifics on the current run, and the 7-day system history (figure 8).

ADDITIONAL INFORMATION
For more information, visit www.waters.com/systemmonitoring or contact your Waters Informatics Sales Specialist.