Baseline Noise: Setting Up Baseline Noise - Tip298
OBJECTIVE or GOAL
Set up baseline noise.
ENVIRONMENT
- Empower
- Empower Tip of the Week #298
PROCEDURE
STEP 1
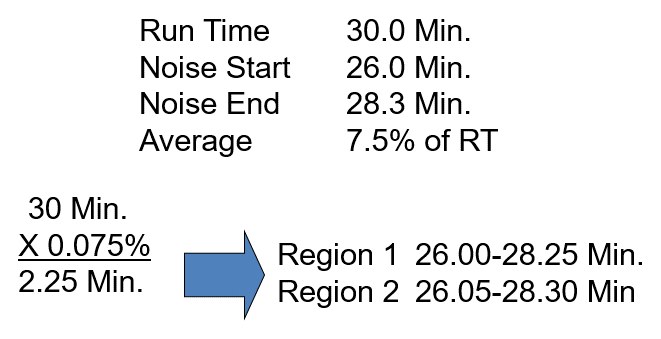
Setting up Baseline Noise involves identifying two regions over which noise will be calculated. Region 1 starts at the start time and ends at a distance in the positive direction equal to the Percent of Run Time to Average. Region 2 starts at the end time and goes the distance of the Percent of Run Time to Average in the negative direction. The area in the time range not incorporated in Region 1 or Region 2 is not used in the calculation. Region 1 and Region 2 can overlap if the start and end time are not set large enough (Figure 1).

STEP 2
In this example the run time was 30 min. The noise region specified in our processing method was 26-28.3 min. The percent of run time to average was set at 7.5%. Therefore, the two noise regions created will each be 2.25 min wide. The Region 1 measured will be 26 to 28.25 min. Region 2 measured will be 26.05 to 28.3 min. Each region will be broken into 30-second segments and an average for each region will be calculated. Then the two regions will be averaged to arrive at the final calculated amount of Baseline Noise (Figure 2).

STEP 3
Region 1 goes from 26 to 28.25 min. The time range is then broken up into 30-second segments. Notice that the last segment is not a full 30 seconds and will therefore not be used in the calculation. The highest point in each 30-second segment is subtracted from the lowest point in each 30-second segment to give the distance of noise for that segment. The segments are then averaged together to calculate the noise for Region 1 (Figure 3).

STEP 4
The Region 2 segment is calculated in the same way as segment one except starting with 28.3 min. Thirty-second segments are created, and noise is measured for each segment. The segments are averaged to give a noise value for Region 2 (Figure 4).

STEP 5
The reported Baseline Noise given by the Empower application is simply the average of Region 1 and Region 2. Although we display them here in AU for consistency, they are always reported in the application with units of mV (Figure 5).

ADDITIONAL INFORMATION
For additional reference, view the example of Baseline Noise in Tip #70.
This can be done with either the Pro or QuickStart interface.

