How Empower calculates amount or concentration - Tip267
OBJECTIVE or GOAL
This article describes how to quantitate external standard calibration with multiple standards each with different amounts of a compound and then quantitate our samples against the calibration curve.
ENVIRONMENT
- Empower
- Empwer Tip of the Week #267
PROCEDURE
STEP 1
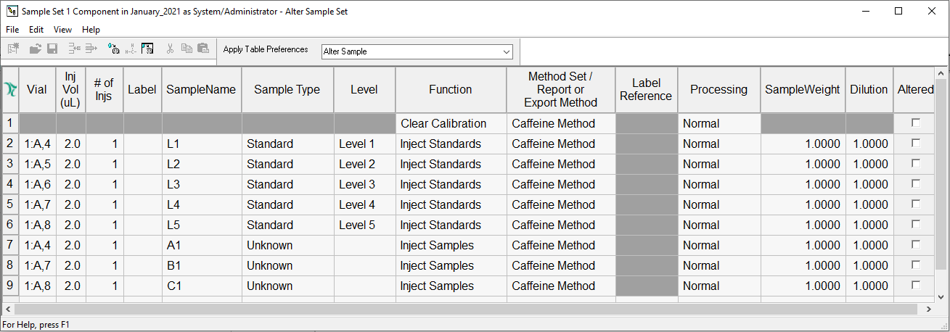
The Sample Set has five standards and three samples. In this example, we leave the Sample Weight and Dilution fields at ‘1’ which are the default values. With those fields set to ‘1’ they have no effect on the calculations and we will discuss those fields in the next tip (figure 1).
STEP 2
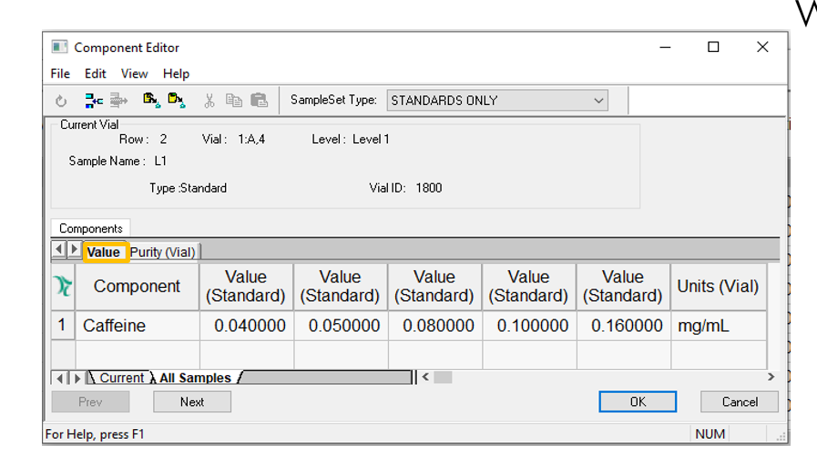
The Component Editor displays ‘1’ component, ‘Caffeine’, with increasing amounts from standard ‘1 thru standard 5’. We are not using the Purity tab and will discuss that in the next tip (figure 2).
STEP 3
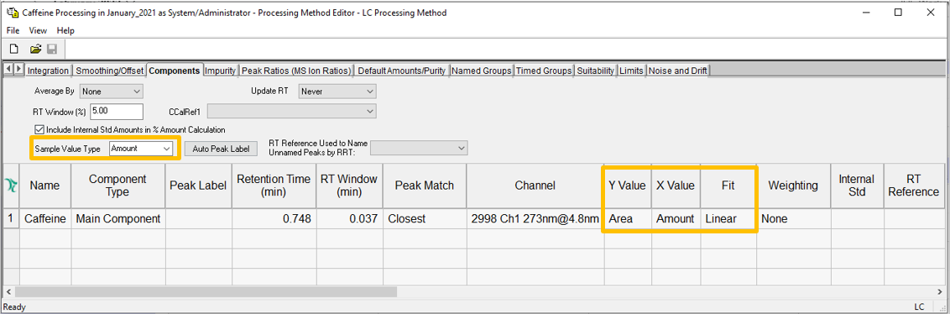
The Processing Method displays one line for the component ‘Caffeine’. The Sample Value Type is ‘Amount’. For the calibration curve the x axis is ‘Amount’, the y axis is ‘Area’, and the fit type is ‘Linear’ (figure 3).
STEP 4
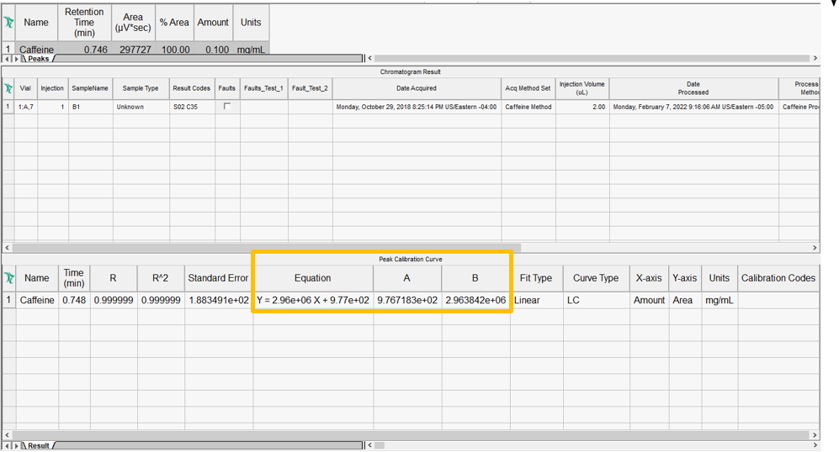
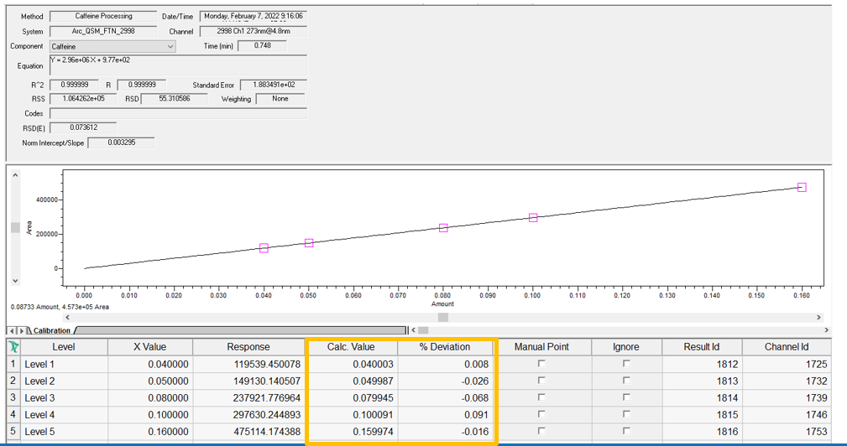
The Sample Set was Processed with the Processing Method. The Results window within Review displays the information about the calibration in the lower table. The equation for the line along with the A & B coefficients is displayed (figure 4).
STEP 5
The Calibration Curve window within Review displays the calibration curve along with the point table. Because we selected a ‘Linear’ fit in the Processing Method, Empower performs a linear fit of the points (figure 5).
STEP 6
The calculated value in the point table can be determined by rearranging the equation for a line and solving for x (figure 6)

STEP 7
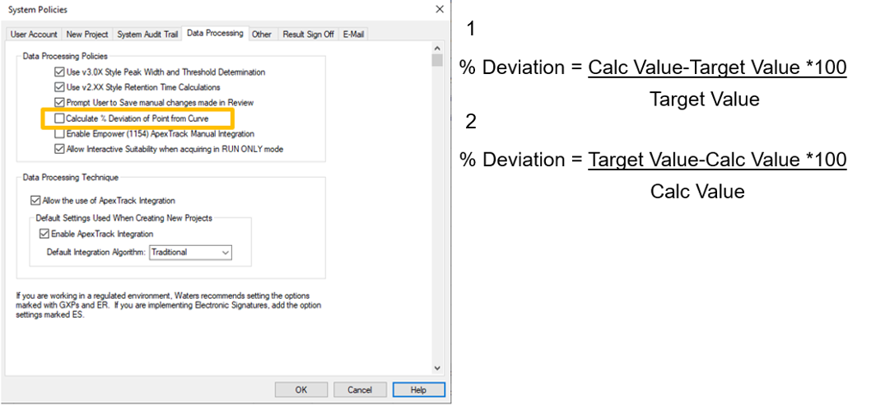
The ‘% Deviation’ calculation depends on the selection of the highlighted System Policy. By default, this System Policy is not enabled and therefore, Empower uses ‘equation 1’. If you enable the System Policy, Empower uses ‘equation 2’ (figure 7).
STEP 8
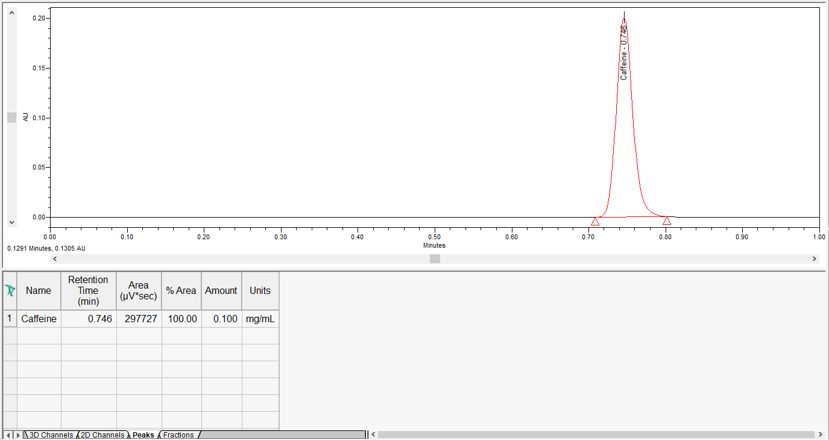
The sample is quantitated, and the amount of Caffeine is calculated and displayed in the Peaks table. Once again, the amount is calculated solving for ‘x’ in slide 6 (figure 8).
ADDITIONAL INFORMATION
Final Note: This can be done with either the Pro or QuickStart interface.