How to create a control chart to plot an attribute of a specified peak or remove a specified peak from a control chart - Tip266
OBJECTIVE or GOAL
Q: How do I create a control chart to plot an attribute of a specified peak or remove a specified peak from a control chart?
Great question.
Let’s get started.
ENVIRONMENT
- Empower
- Empower Tip of the Week #266
PROCEDURE
STEP 1
In this example, we have a Control Chart to track retention time of peaks throughout a sample set. Acetone is a void volume marker and we do not want it included in the Control Chart (figure 1).

STEP 2
In the properties of the summary plot, we cannot create a peak level filter (figure 2).

STEP 3
If we add a white rectangle to the report and group it with the summary report, the composite group will allow us to create a peak level filter. Add the white rectangle to the report (figure 3).

STEP 4
Control click both groups and from the Edit menu, select ‘Group’ (figure 4).

STEP 5
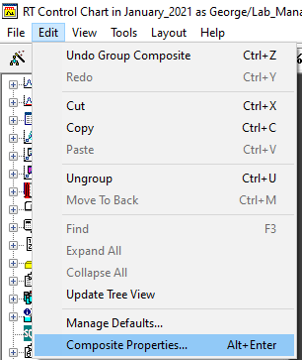
From the Edit menu, select ‘Composite Properties’ (figure 5).
STEP 6
We can filter using a peak field (figure 6)

STEP 7
Create the condition to filter out the Acetone peak (figure 7).

STEP 8
Acetone has now been filtered out of the control chart (figure 8).

ADDITIONAL INFORMATION
Final Note: This can be done with either the Pro or QuickStart interface.
id227863, EMP2LIC, EMP2OPT, EMP2SW, EMP3GC, EMP3LIC, EMP3OPT, EMP3SW, EMPGC, EMPGPC, EMPLIC, EMPOWER2, EMPOWER3, EMPSW, SUP