Working with UV spectra in Spectrum Review - Tip263
OBJECTIVE or GOAL
UV spectra can be mathematically combined using simple mathematical functions such as +, -, x and /.
A practical example of using this function is to help determine the identification of an impurity co-eluting with another peak. We can determine the UV spectrum of the impurity (and possibly its identification) by subtracting the UV spectrum of the main component from the UV spectrum at the point of Maximum Impurity. We can then perform a library search to attempt identification of the component.
ENVIRONMENT
- Empower
- Empower Tip of the Week #263
PROCEDURE
STEP 1
The first peak in the chromatogram is not spectrally pure and the apex spectrum matches to Methyl Paraben (figure 1).

STEP 2
The table and Purity Plot show the point of Maximum Impurity at 1.345 minutes (figure 2).

STEP 3
You can load a library and its spectra into Spectrum Review by selecting ‘Load Library’ from the Library menu. Highlight the library and click ‘Load’ (figure 3).

STEP 4
The library spectra are loaded into Spectrum View; however, they are not displayed in the plot. You can differentiate these spectra from the peak spectra because library spectra are named (figure 4).

STEP 5
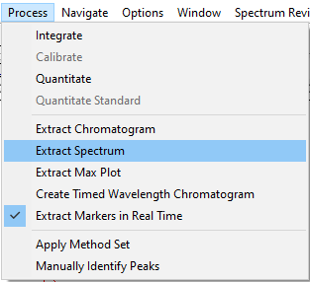
Using either the tool or the Process menu, select ‘Extract Spectrum’ (figure 5).
STEP 6
Extract the spectrum at the point of Maximum Impurity (figure 6).

STEP 7
A comparison of the extracted spectrum to the spectrum for Methyl Paraben shows a similar shape and lambda max, the only difference appears to be absorbance. This is to be expected as the Methyl Paraben is most likely the predominate component under the peak (figure 7).

STEP 8
Deselect all spectra from ‘Spectrum Review’ expect for the extracted spectrum. From the Spectrum Review menu, select ‘Derived Spectrum’. Since the absorbance of the Methyl Paraben spectrum is approximately 2.4 times larger than the absorbance of the impurity spectrum enter a value of 2.4 in the Constant field on the left. Select ‘–‘ from the Operator list. Select the Methyl Paraben spectrum from the Second Spectrum list, then click ‘OK’ (figure 8).

STEP 9
The result of the subtraction is the “Blended” spectrum (figure 9).

STEP 10
To identify the spectrum, go to ‘Match Parameters’ and set the Search Threshold (deg) to 90 and click ‘OK’. From the Library menu, select ‘Match against library [name of library]’ (figure 10).

STEP 11
The spectrum is identified as Benzoic Acid, and in reality, the peak consists of 99% Methyl Paraben and 1% Benzoic Acid. Therefore, we were able to identify the impurity correctly (figure 11)

ADDITIONAL INFORMATION
Final Note: This can be done with either the Pro or QuickStart interface.
id227373, EMP2LIC, EMP2OPT, EMP2SW, EMP3GC, EMP3LIC, EMP3OPT, EMP3SW, EMPGC, EMPGPC, EMPLIC, EMPOWER2, EMPOWER3, EMPSW, SUP