Working with Derivatives of UV Spectra and the Splining Function - Tip264
OBJECTIVE or GOAL
In this article for Empower Chromatography Data System (CDS), we will work with derivatives of UV spectra and also learn about the Splining function
ENVIRONMENT
- Empower
- Empower Tip of the Week #264
PROCEDURE
Derivatives
STEP 1
Start with the UV spectrum for Caffeine in Sample 1, the peak in this sample is spectrally pure (figure 1).

STEP 2
From the Spectrum Review menu, select ‘Keep Spectra When Switching Channels’ (figure 2).

STEP 3
Select the UV spectrum for Caffeine in Sample 2, the peak in this sample has an impurity as we saw in an earlier tip. The stack plot of the two spectra shows that the shape and lambda max appear to be the same (figure 3).

STEP 4
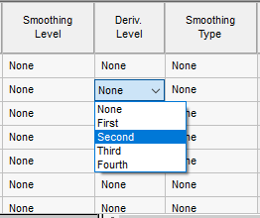
Empower can use derivatives of UV spectra to enhance the differences between them. In the Spectra table, select ‘Second’ in the ‘Deriv. Level’ field (figure 4).
STEP 5
Now the differences between the spectra are discernible and are due to the impurity under the Caffeine peak in Sample 2. Smoothing is automatically applied to the derivative of the spectra (figure 5).

Splining
STEP 6
Splining can enhance the display of a UV spectrum. We see the original UV spectrum for Caffeine with a digital resolution of 0.6nm (figure 6).

STEP 7
Select ‘Spline’ in the Spline field for the spectrum (figure 7).

STEP 8
The digital resolution is now 0.2 nm. The interpolated points are calculated by performing a cubic Spline operation (figure 8).

ADDITIONAL INFORMATION
Final Note: This can be done with either the Pro or QuickStart interface.