Multi Component Peak Purity on the PDA and QDa Detector - Tip258
OBJECTIVE or GOAL
Once you conclude that a peak is not spectrally pure, you may want to know how many spectrally different components are under the chromatographic peak. Multi Component Peak Purity will help. Here's how:
ENVIRONMENT
- Empower
- Empower Tip of the Week #258
PROCEDURE
STEP 1
Looking at the Caffeine peak in one the samples, you can conclude that the peak is not spectrally pure. The Purity Angle is greater than the Purity Threshold and the Purity Plot displays the Purity line above the Threshold line towards the tail of the peak. (This screen is found in Review by selecting the Results tool) (figure 1).

STEP 2
Add a marker to display the ‘Point of Maximum Impurity’ which is the point across the peak with the maximum value for the ratio of Purity Angle/Purity Threshold. Select ‘Annotate Peak Apex / Max Impurity’ in the plot properties (figure 2).

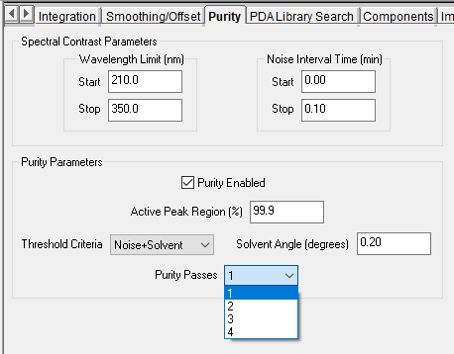
STEP 3
To determine how many spectrally different components are under the Caffeine peak, go to the Purity tab of the Processing Method and use the ‘Purity Passes’ function, Purity Pass ‘1’ is the default (figure 3)
STEP 4
Set the Purity Passes to ‘2’, Empower chooses two analysis spectra: the ‘apex spectrum’ and the ‘maximum impurity spectrum’ obtained from Purity Pass 1. Empower then compares these 2 analysis spectra to each of the remaining spectra across the peak.
• For each peak spectrum, Empower sums the two analysis spectra to produce a model spectrum.
• In creating the sum, Empower first applies a scaling factor to each analysis spectrum. The shape and normalization of the model spectrum depends on the values of these scale factors.
• Empower the adjusts the two scale factors, changing the shape and normalization of the model spectrum, until it finds a model spectrum that is the best match, in a least squares sense, to the targeted peak spectrum.
• Empower calculates the spectral contrast angle between this best match model spectrum and the targeted peak spectrum. Empower plots this angle on the Purity Plot for the second Purity
Pass.
• After repeating the above steps for each peak spectrum, Empower plots the Purity Angle for the second Purity Pass for the entire peak, calculates the Purity Angle for the second Purity Pass and finds the maximum impurity spectrum for Purity Pass 2.
• For the third Purity Pass, Empower uses the Apex Spectrum, the maximum impurity spectrum from Purity Pass 1 and the maximum impurity spectrum from Purity Pass 2 to create the model spectrum and proceeds.
• For the fourth Purity Pass, I think you know what happens.
The math works because if the targeted and analysis spectra are all mixtures of two compounds, then all the targeted spectra will match, the respective “best fit” sums of two analysis spectra. If the targeted and analysis spectra are all mixtures of three compounds, then some targeted spectra will not match the “best fit” sums of two analysis spectra but will match all the “best fit” sums of three analysis spectra.
STEP 5
Reprocessing the data with two Purity Passes results in the following. The Purity Angle for the second Purity Pass is less than the Purity Threshold and the Purity Plot for the second Purity Pass displays the green line below the blue line across the peak. The line with the ‘M’ in the plot is the point of maximum impurity from Purity Pass 1 and the line with the ‘2’ is the point of maximum impurity from Purity Pass 2 (figure 4).

STEP 6
The conclusion for this peak is that there are two spectrally different components under the peak, Caffeine and an impurity. Please see the chart that summarizes the conclusion for each Purity Pass (figure 5).

ADDITIONAL INFORMATION
Final Note: This can be done with either the Pro or QuickStart interface.