PDA and QDa Peak Purity - Processing and Reviewing Results - Tip257
OBJECTIVE or GOAL
Once the Sample Set, Injections or Channels have been processed, we can begin to assess Peak Purity for the peaks in the chromatograms. 3D data must be processed with a Method Set which contains the derived channels and associated Processing Methods. We must look at the numerical values for Purity Angle and Purity Threshold and the Purity Plot before coming to any conclusions. When using both the PDA and the QDa Mass detector, we also look at the Purity View in the Mass Analysis window.
Let’s begin by looking at the results of some samples, the Caffeine peak.
ENVIRONMENT
- Empower
- Photodiode Array Detector
- ACQUITY QDa Mass Detector
- Empower Tip of the Week #257
PROCEDURE
STEP 1
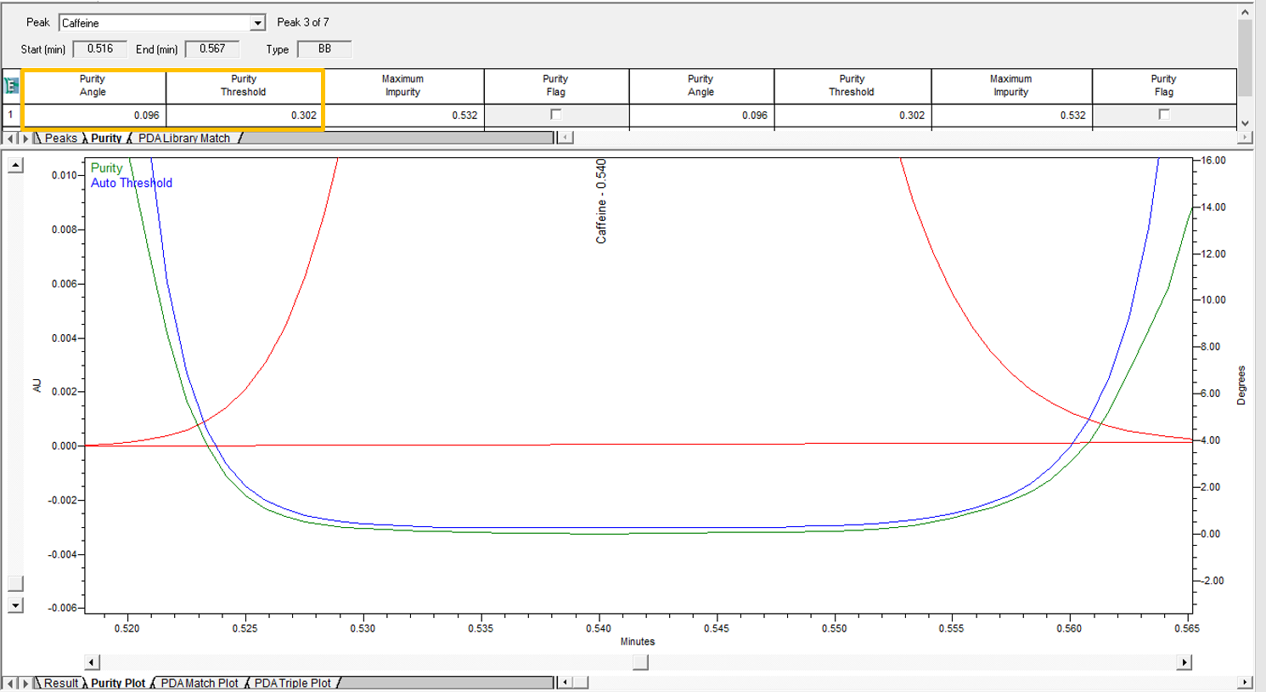
The first sample has a Purity Angle less than the Purity Threshold. The Purity Plot displays the Purity Angle (green line) below the Purity Threshold (blue line) across the entire peak. In this case, we conclude that the peak is spectrally homogenous based on the PDA data (figure 1).
STEP 2
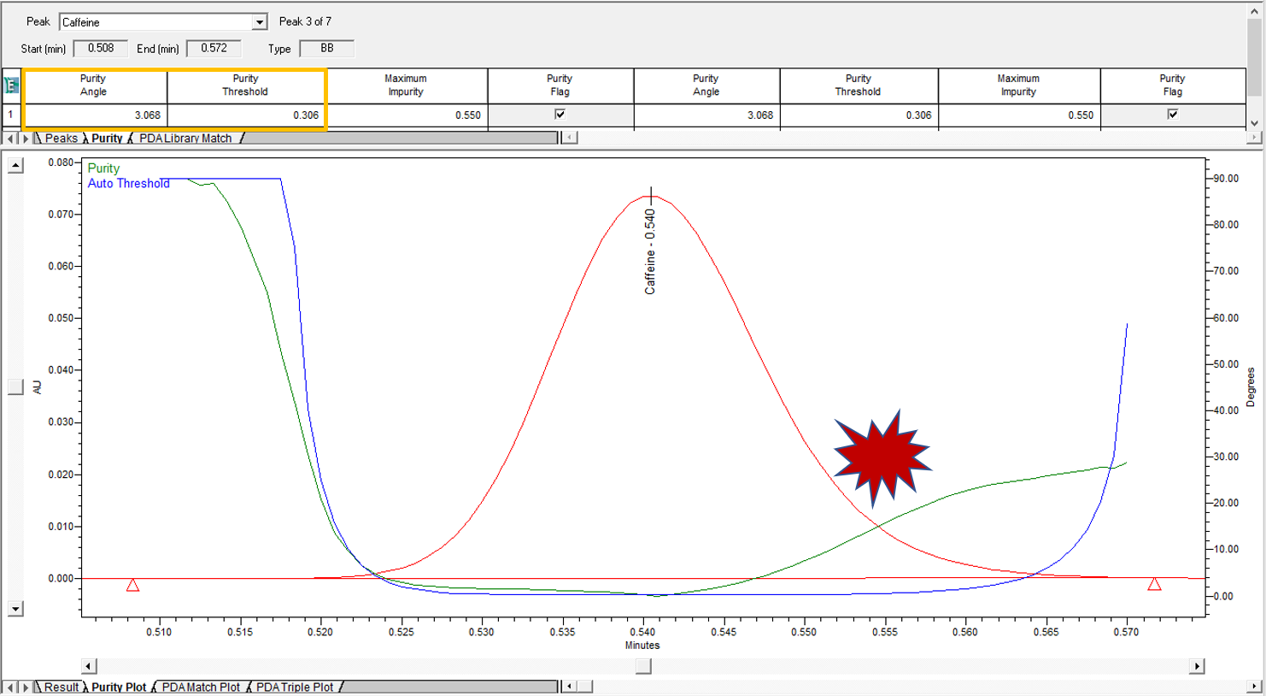
The second sample has a Purity Angle greater than the Purity Threshold. The Purity Plot displays the Purity Angle line above the Purity Threshold line towards the tail of the peak. In this case, we conclude that the peak is not spectrally pure based on the PDA data (figure 2).
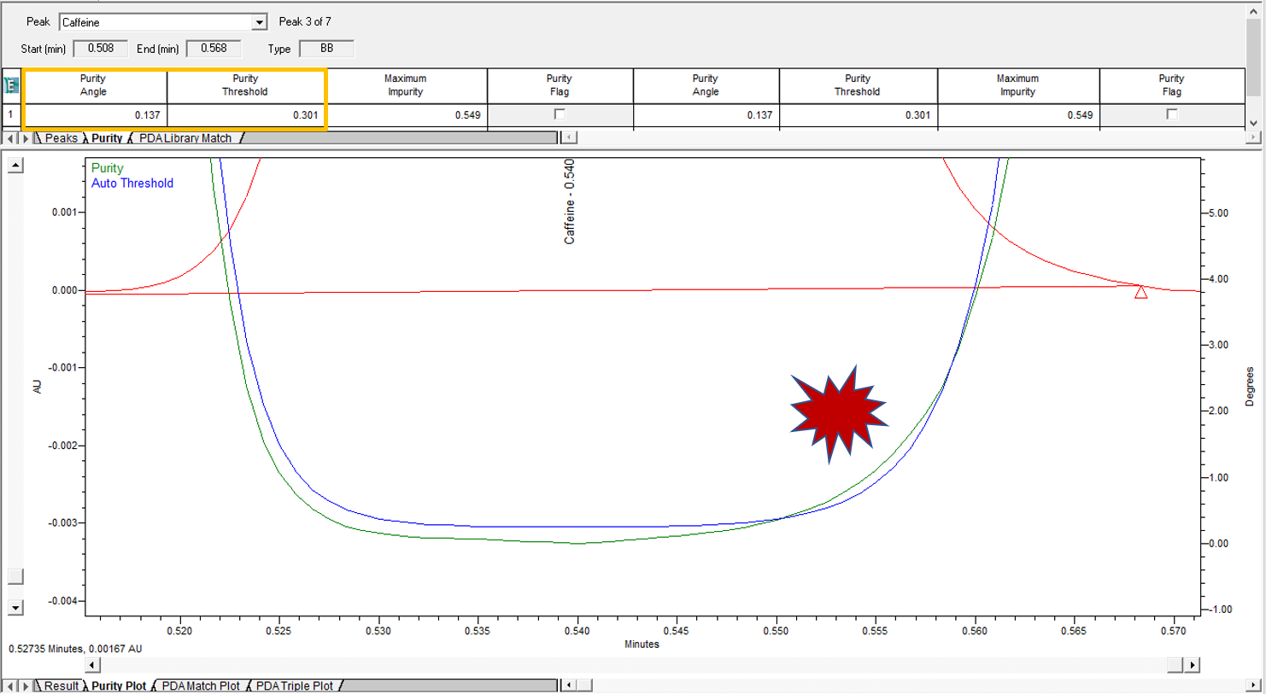
STEP 3
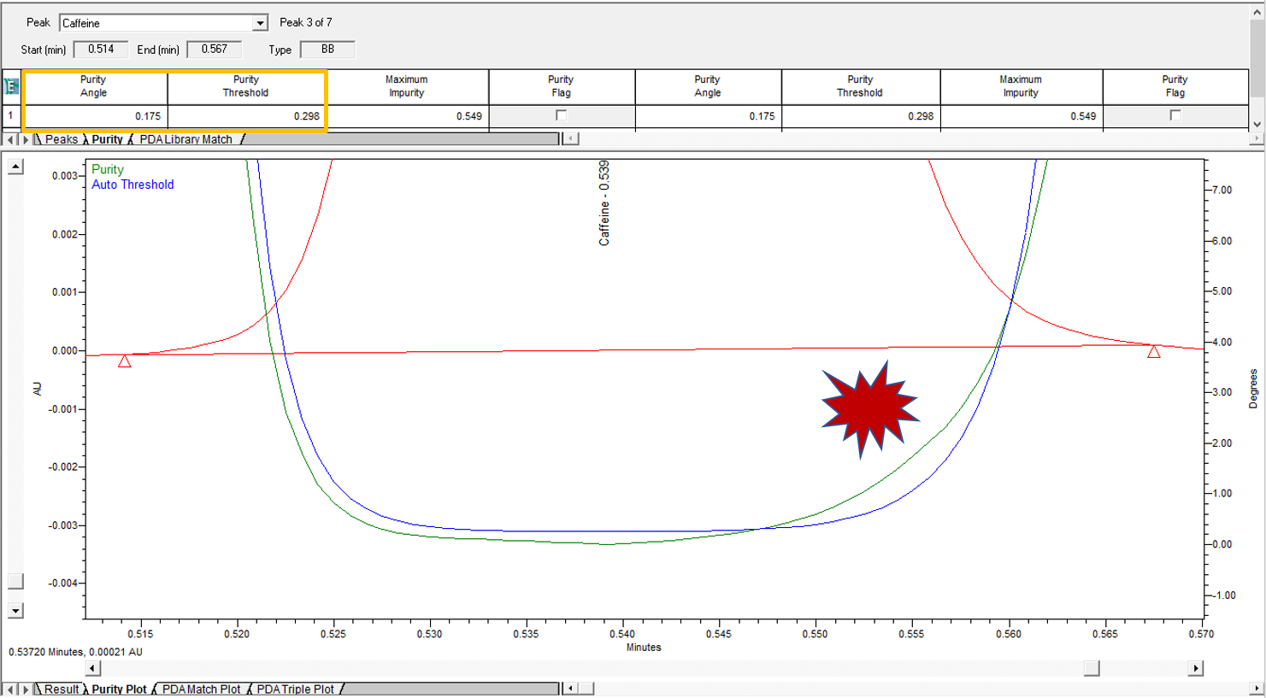
The third sample is a bit tricky. While the Purity Angle is less than the Purity Threshold, the Purity Plot displays a problem in the tail of the peak. How do we reconcile this difference? (figure 3)
STEP 4
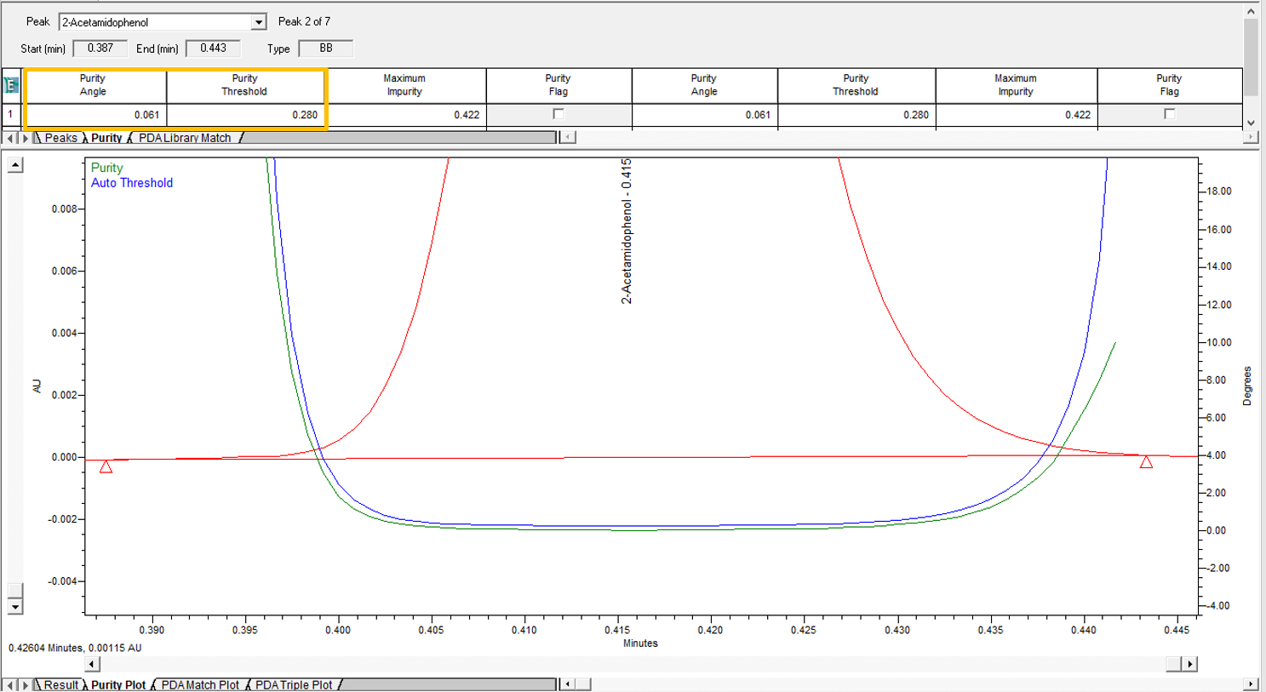
If we compare the results of the Caffeine peak to the 2-Acetamidophenol peak, we see roughly the same Purity Threshold. However, the Purity Angle for Caffeine is approximately 3 times larger than the Purity Angle for the 2-Acetomidophenol. Given that the peaks are at roughly the same absorbance, we should expect similar Purity Angles. This is another indication that there is a problem with the Caffeine peak in this sample (figure 4).
STEP 5
The next sample has a similar problem to Sample 3. The Purity Angle is less than the Purity Threshold, however, the Purity Plot displays a problem in the tail of the peak. The Purity Plot is a sensitive tool for detecting spectral differences across a peak (figure 5).
STEP 6
In this example, we see the Purity Plot and Purity View in the Mass Analysis window for a relatively small peak. In this case, the numbers, the Purity Plot, and a consistent primary mass across the peak, lead us to the conclusion that the peak is spectrally pure (figure 6).
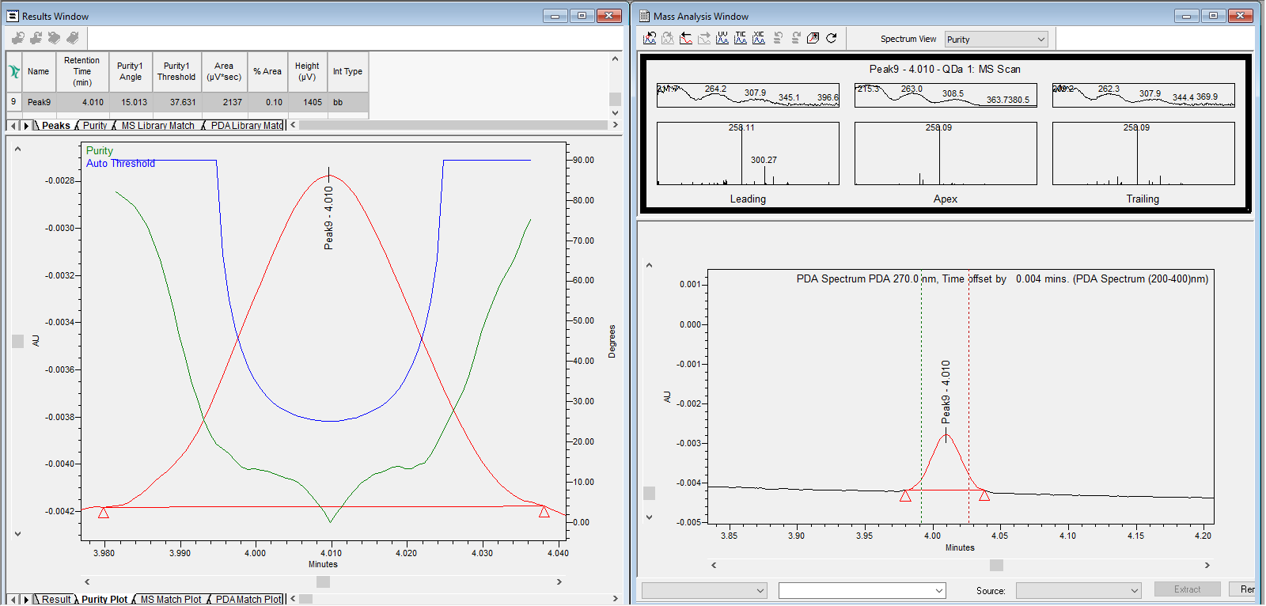
STEP 7
A final point, when developing a new method, you may want to consider an ‘orthogonal technique’ (trying a different mode of separation or at least a different type of column) to add to the evidence that a peak or peaks in a chromatogram are spectrally pure.
ADDITIONAL INFORMATION
Final Note: This can be done with either the Pro or QuickStart interface.