Reporting Peak Purity Results on the PDA and QDa Detectors - Tip259
OBJECTIVE or GOAL
ENVIRONMENT
- Empower
- Empower Tip of the Week #259
PROCEDURE
STEP 1
If you are new to creating Report Methods, I recommend copying the default Report Methods from the PDA Defaults project into your working project. Highlight the Report Methods from PDA Defaults, right click and select ‘Copy to Project’. Select your project, click ‘OK’ (figure 1).

STEP 2
One of those Report Methods, the PDA Purity Plot report, displays one Purity Plot for each peak. The Purity Angle and Purity Threshold will be displayed below each plot (figure 2).

STEP 3
Add Peak Purity results from the QDa Mass detector to our report by adding the Mass Analysis Plot to the report (figure 3).

STEP 4
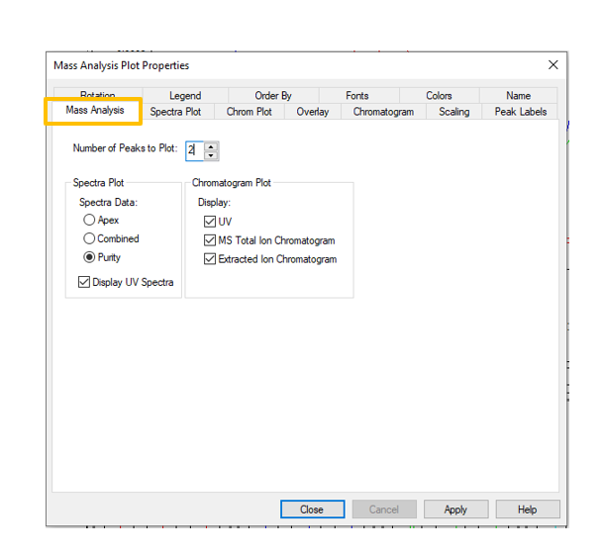
In the properties of the Mass Analysis Plot, select ‘Purity’ on the Mass Analysis tab. You can limit the number of peaks plotted per page to make it easier to see the Purity View (figure 4).
STEP 5
Just as in Review, you can see the UV and MS spectra from the leading edge, apex, and trailing edge for each peak (figure 5).

STEP 6
If you do Multi Component Peak Purity as described in Tip #258, the ‘4 Pass Peak Purity Report’ (also found in the PDA Defaults project) will display a purity plot for each Purity Pass for every peak (figure 6).

STEP 7
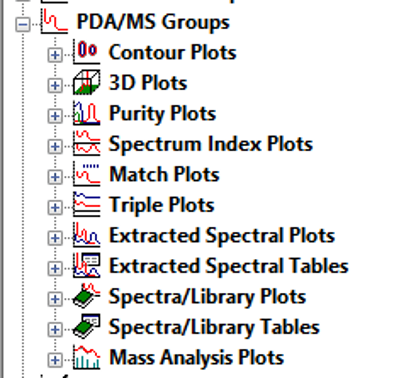
The plots described above can be found under PDA/MS Groups in the Report Publisher (figure 7).
STEP 8
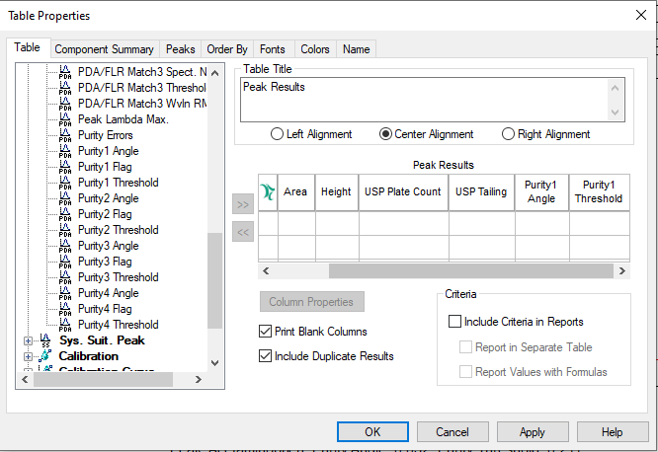
Purity Angles and Purity Thresholds can be added to any existing report table by looking under PDA Peak (figure 8).
ADDITIONAL INFORMATION
Final Note: This can be done with either the Pro or QuickStart interface.