Peak Purity using the QDa Detector - Tip253
OBJECTIVE or GOAL
This article will discuss Peak Purity using the QDa Detector
ENVIRONMENT
- Empower
- Empower Tip of the Week #253
PROCEDURE
STEP 1
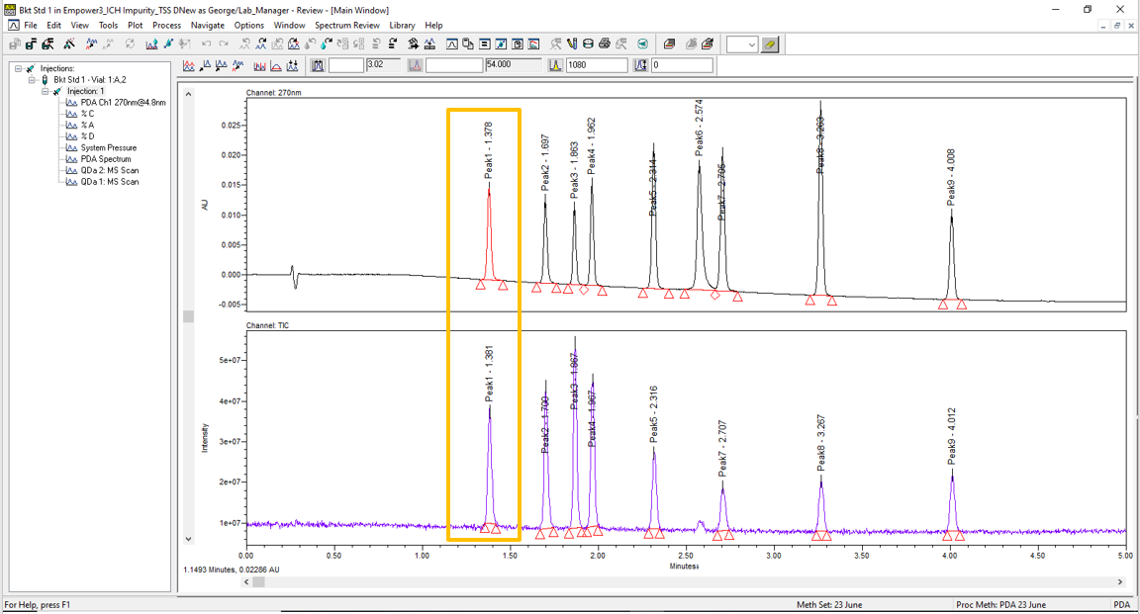
When the Photodiode Array (PDA) Detector and QDa Detectors are connected in series, there is a time offset between the two, i.e., the peaks will elute earlier on the PDA Detector. The first peak has a retention time of 1.378 minutes in the UV chromatogram and 1.381 in the MS chromatogram (figure 1).
STEP 2
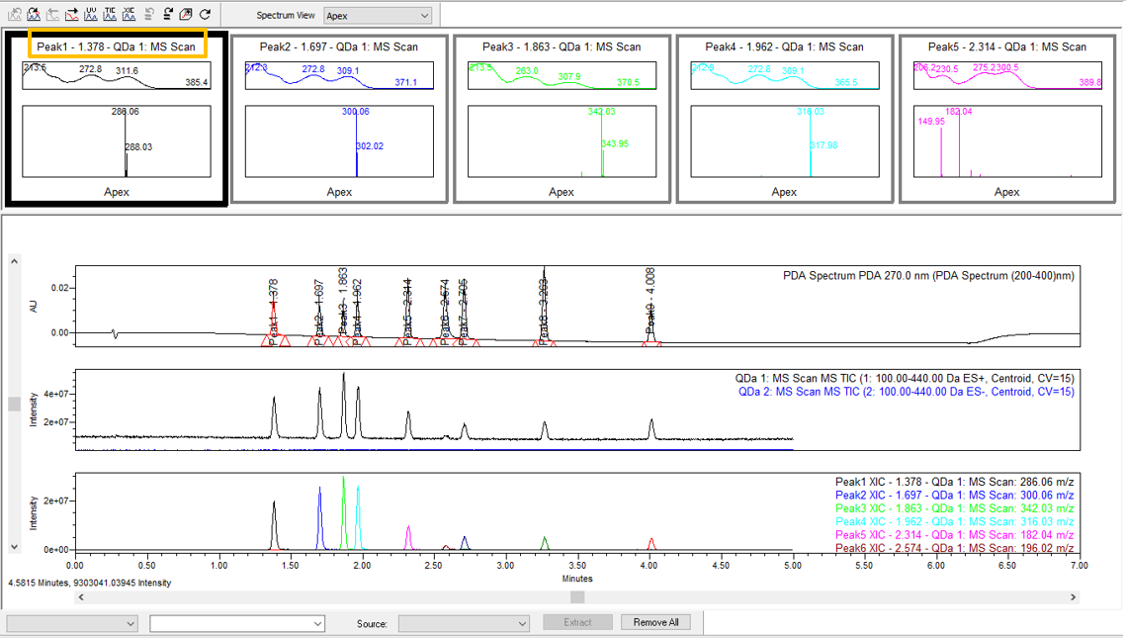
In the Mass Analysis window, Empower takes the Apex spectra (both UV and MS) from the retention times of the peaks in the UV chromatogram. The MS spectra are extracted a little bit earlier than desired (figure 2)
STEP 3
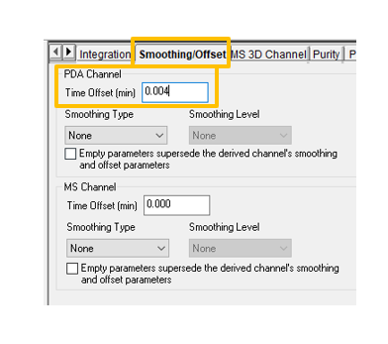
You can correct for the offset on the Smoothing/Offset tab in the Processing Method. Calculate the average difference in retention times between the two channels and enter that value in the Time Offset (min) field for the PDA Channel (figure 3)
STEP 4
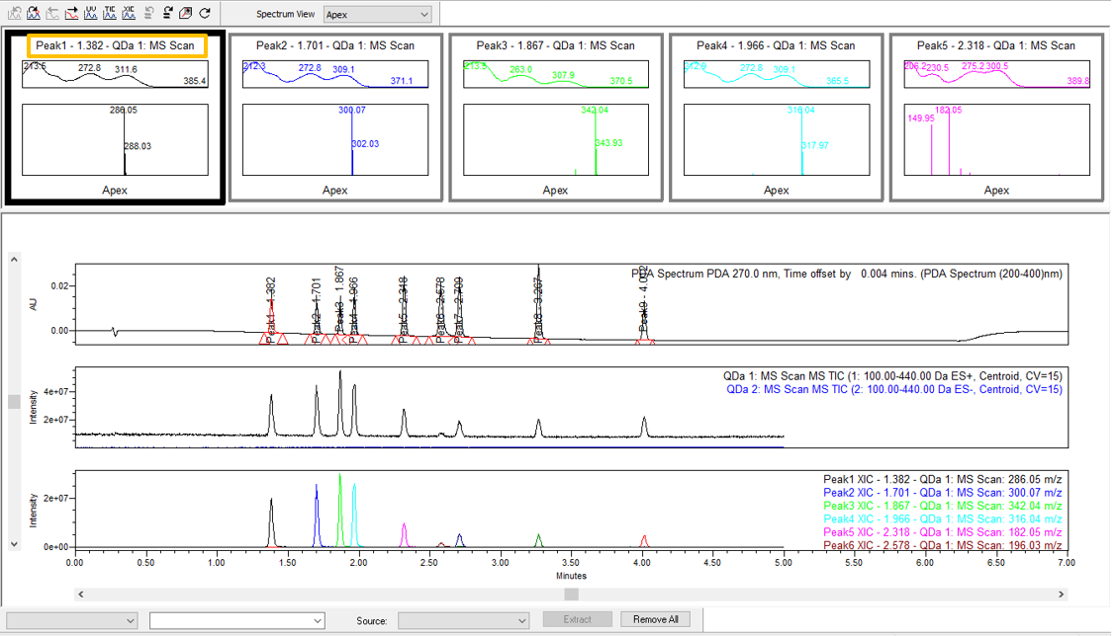
Now the MS spectra are extracted at the proper times (figure 4).
STEP 5
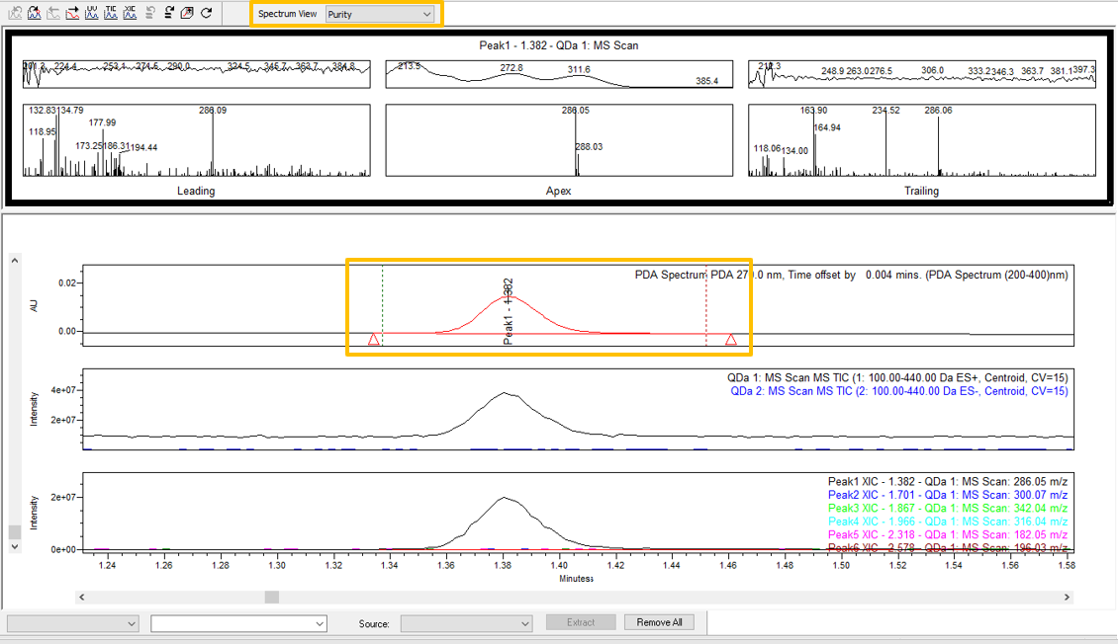
Changing to Purity view, Empower displays the MS spectra from the leading edge, apex and trailing edge of each of the integrated peaks. In the first peak, the MS spectra for the leading and trailing edge are noisy as they are being extracted from the baseline (figure 5).
STEP 6
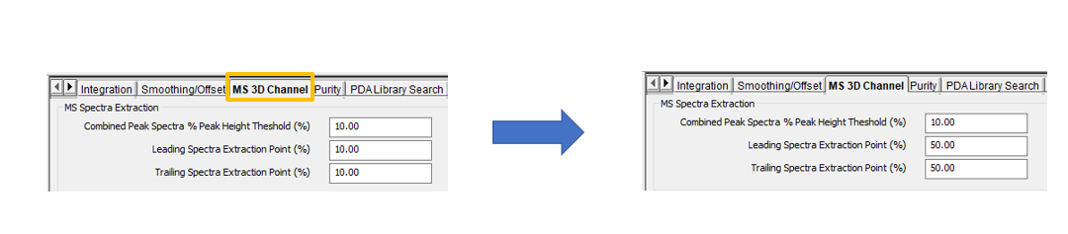
There are two factors which can influence where Empower extracts those spectra. The integration can be adjusted so that the peak starts/ends are not in the noisy baseline. You can also adjust where Empower extracts those spectra on the MS 3D Channel tab under MS Spectra Extraction. The percentage is from peak start to the retention time of the peak. For example, if you set the Leading Extraction Spectra Point (%) to 50, then it extracts the leading-edge spectrum halfway between peak start and the retention time (figure 6).
STEP 7
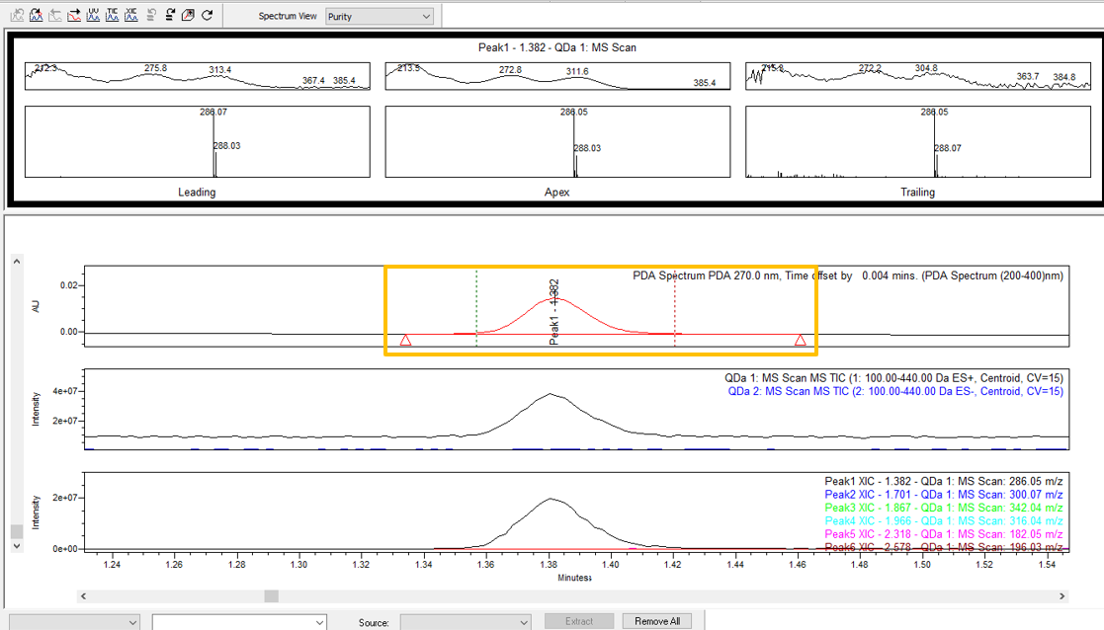
The resulting spectra for the leading and trailing edges are not as noisy, and in this case, the MS spectra appear to be consistent over the three points across the peak (figure 7).
ADDITIONAL INFORMATION
Final Note: This can be done with either the Pro or QuickStart interface.