Spectral Contrast Algorithm: The Math Behind Peak Purity Calculations - Tip252
OBJECTIVE or GOAL
In this article we discuss the Spectral Contrast algorithm, the math behind Peak Purity calculations when using the ACQUITY™ PDA Detector.
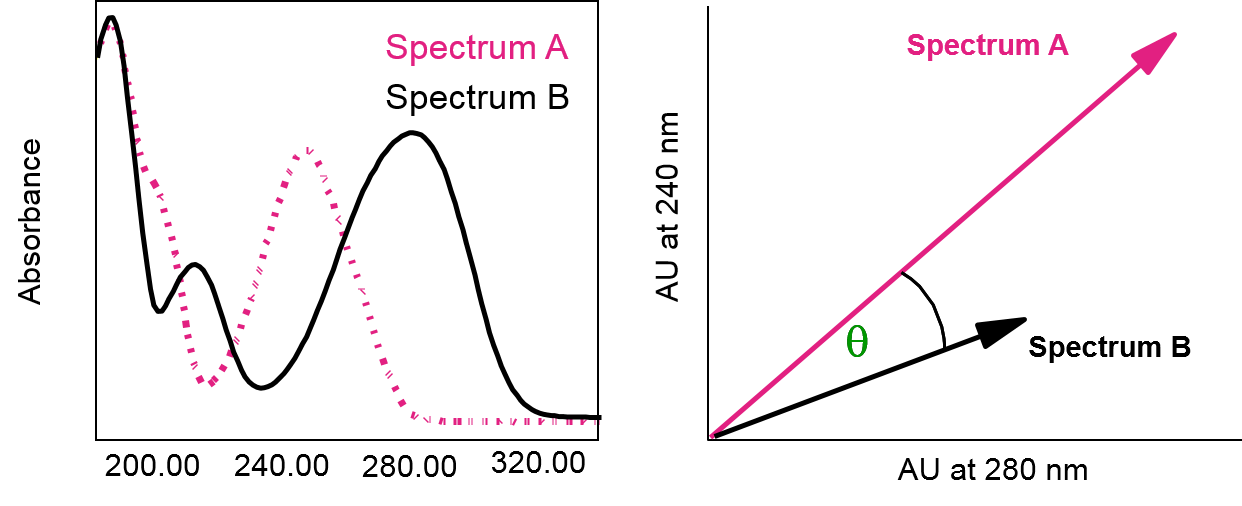
The Spectral Contrast algorithm measures the shape difference between spectra as per the following steps:
• Spectra are baseline corrected by subtracting interpolated baseline spectra between peak baseline liftoff and baseline touchdown
• Spectra are converted into vectors in n-dimensional space
• Vector lengths are normalized
• The vectors are moved into a two-dimensional plane and the angle between them is measured
• An angle of 0 degrees means the spectral shape is identical and an angle of 90 degrees indicates no spectral overlap
ENVIRONMENT
- Empower
- Empower Tip of the Week #252
PROCEDURE
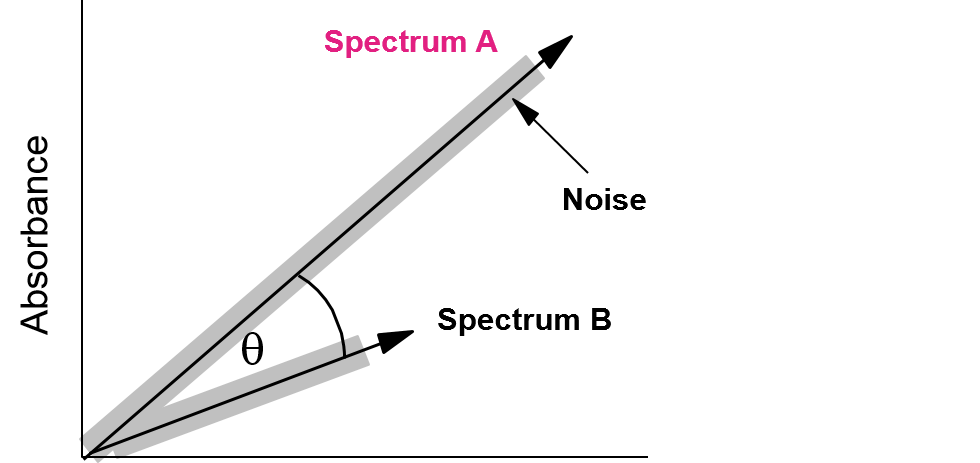
Spectral Contrast Angle
The shapes of Spectrum A and Spectrum B are represented by vectors. is the Spectral Contrast Angle which is the difference between spectral shapes (figure 1).
EXAMPLE 1
In the first example, we have two very different compounds resulting in a Spectral Contrast Angle of 53 (figure 2).

EXAMPLE 2
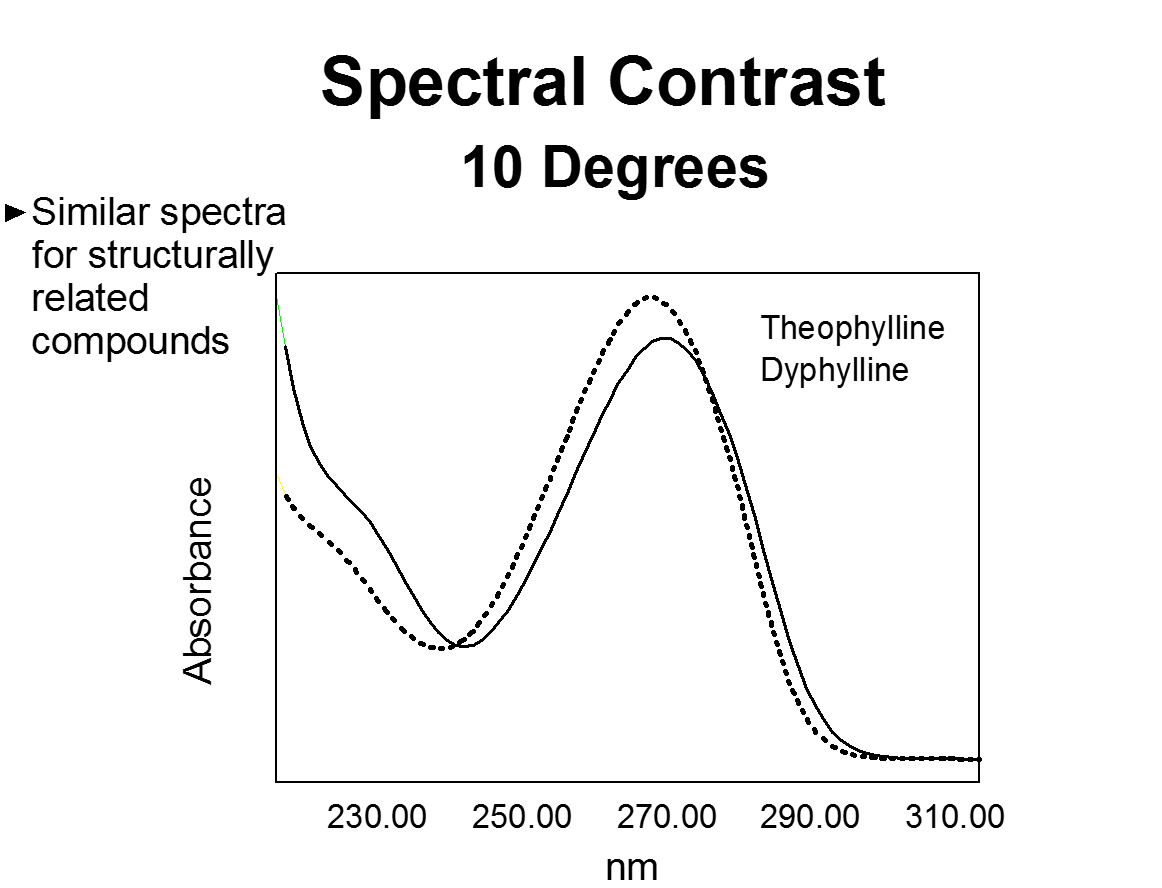
In the second example, we have two compounds which are structurally related resulting in a Spectral Contrast Angle of 10 (figure 3).
EXAMPLE 3
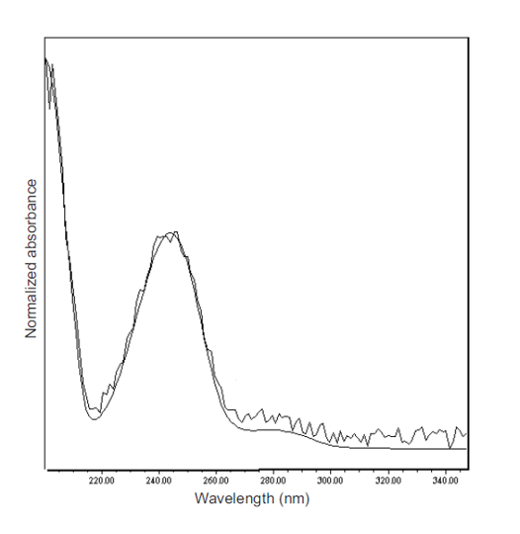
In the third example, we have two compounds which are very similar and only differ by a CH2 resulting in a Spectral Contrast Angle of 0.5 (figure 4).

Threshold Angle
Small but significant differences between spectra can result from factors other than absorbance properties. Multiple spectra of the same compound may exhibit slight differences because of:
• Detector Noise – statistical and thermal variations add electronic noise to the absorbance measurement, which is magnified when viewing spectra for the same compound at different concentrations (figure 5).
This results in fluctuations in the baseline and is called baseline noise. The magnitude of this noise can be predicted by selecting a Noise Interval in the Processing Method.
• Photometric Error – at absorbance greater than 1AU, a combination of effects can produce slight variations in Beer’s Law. While this has a negligible effect on quantitation, it can be a significant source of spectral inhomogeneity (figure 6).

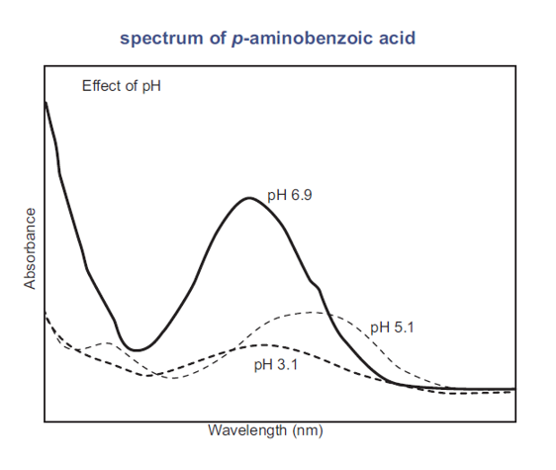
• Variations in Solvent Composition – changes in solvent pH or composition during gradient chromatography can affect the shape of a spectrum (figure 7).
• High Sample Concentration
The Threshold Angle is the largest Spectral Contrast Angle between spectra due to nonideal phenomena (figure 8).
Comparing the Spectral Contrast Angle to the Threshold Angle helps to determine whether the shape difference between spectra is significant. In general, a Spectral Contrast Angle less than its Threshold Angle indicates that the shape differences are due to nonideal phenomena and that no evidence exists for significant differences between the spectra. A Spectral Contrast Angle greater than its Threshold Angle indicates that the shape differences are due to significant differences between the spectra.
ADDITIONAL INFORMATION
Final Note: This can be done with either the Pro or QuickStart interface.