Considerations for Collecting Data Suitable for Peak Purity Determination - Tip251
OBJECTIVE or GOAL
In this tip, we begin a new series on Peak Purity using both the ACQUITY™ PDA Detector and ACQUITY QDa™ Mass detector. We will discuss Peak Purity and the considerations for collecting data suitable for Peak Purity determination?
ENVIRONMENT
- Empower
- Empower Tip of the Week 251
PROCEDURE
STEP 1
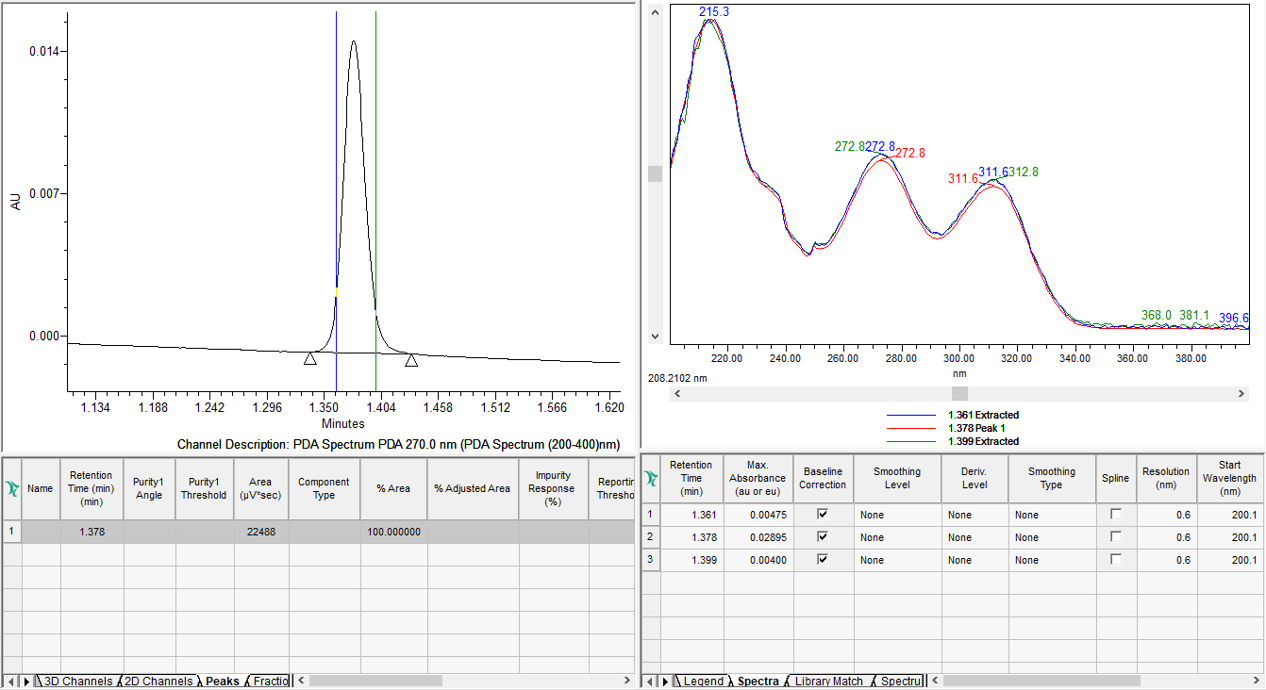
Peak Purity is spectral purity or spectral homogeneity. Peak Purity is not chemical purity. If we extract spectra across a peak and normalize them, do they overlay? If YES, chances are there is one component under the peak. If NO, there are multiple components under the peak. We can use UV spectra from the ACQUITY PDA Detector (figure 1)
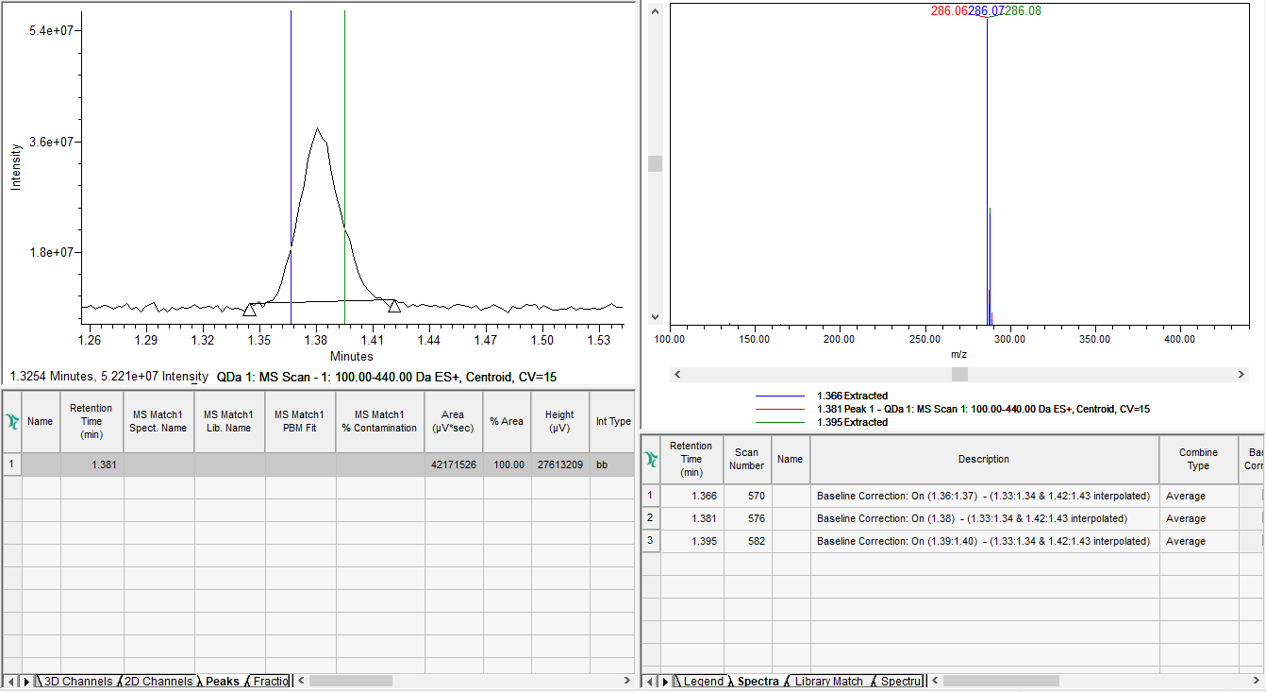
or MS spectra from the ACQUITY QDa Mass Detector to evaluate Peak Purity (figure 2).
STEP 2
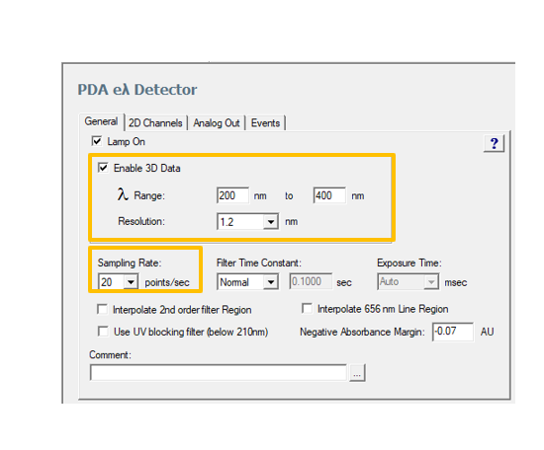
The following parameters in the ACQUITY PDA Instrument Method are critical when evaluating Peak Purity (figure 3).
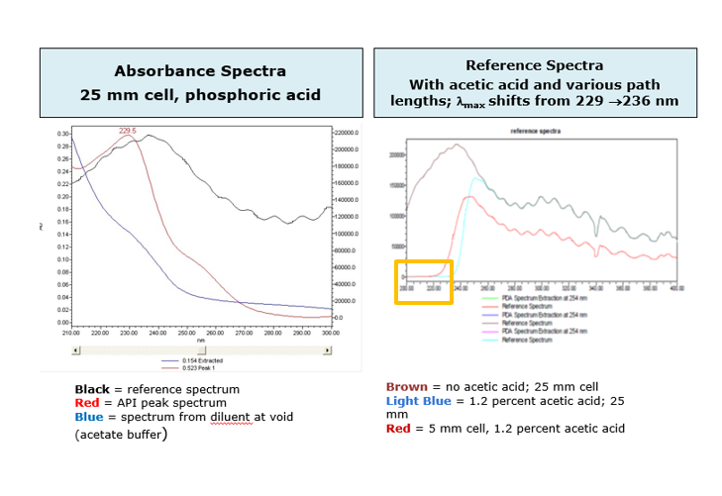
• Wavelength Range: Start above the UV cutoff of the mobile phase and end at a wavelength that encompasses all areas of absorbance. If the mobile phase has a solvent or buffer that absorbs at the low end, the absorbance by the mobile phase will lower the linear dynamic range of the detector by the amount of absorbance that is autozeroed out (figure 4)
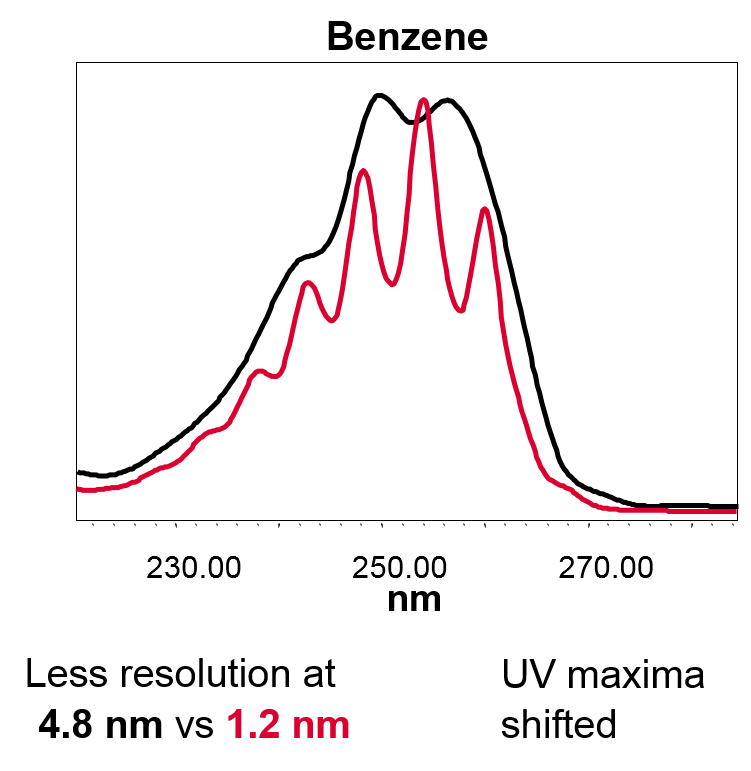
• Resolution: Select 1.2nm which will give you the best possible spectral resolution (figure 5)
• Sampling Rate: Select a rate that will provide at least 12 spectra across the narrowest peak of interest, 15-20 spectra is optimum.
STEP 3
The following parameters in the ACQUITY QDa Mass Detector Instrument Method are critical when evaluating Peak Purity (figure 6)
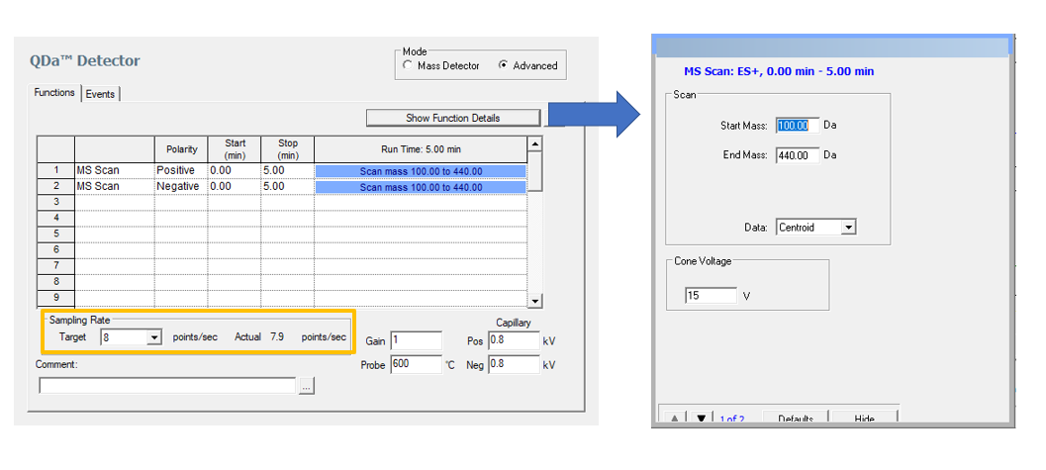
• Mass Range: Select an appropriate range
• Sampling Rate: Select a rate that will provide 15-20 spectra across the narrowest peak of interest. Mass Detectors do adjust the Sampling Rate in the instrument method based on the mass range that you enter. That means for large mass ranges the software automatically adjusts the Sampling Rate to a lower value – and the reverse is true, i.e. for a smaller range it will calculate a higher Sampling Rate.
STEP 4
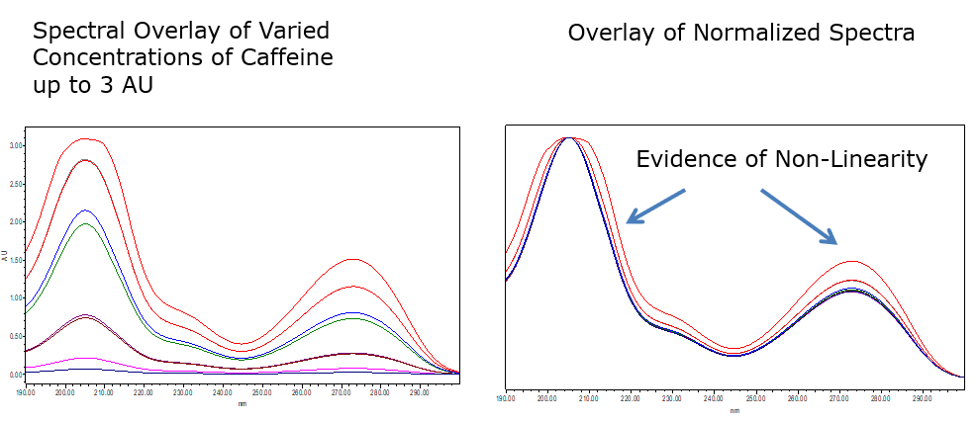
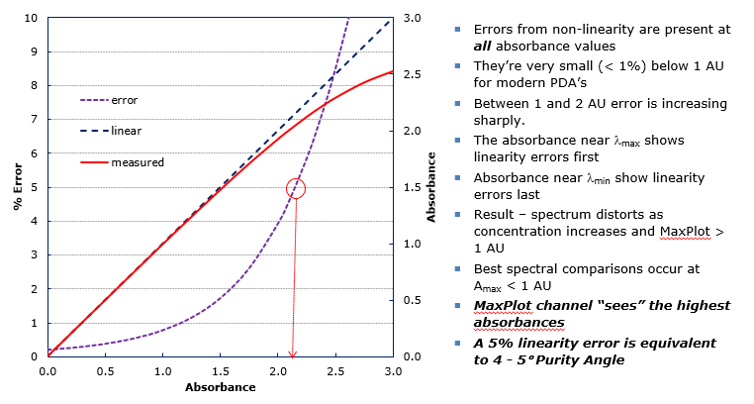
Keep the absorbance of all peaks less than 1 AU according to MaxPlot. Why? At high absorbances a combination of effects can produce slight departures (approx. 1%) from Beer’s law because of photometric error. Although these errors at this level have a negligible effect on quantitation, they can be a source of spectral inhomogeneity and result in distortion of spectra (figure 7).
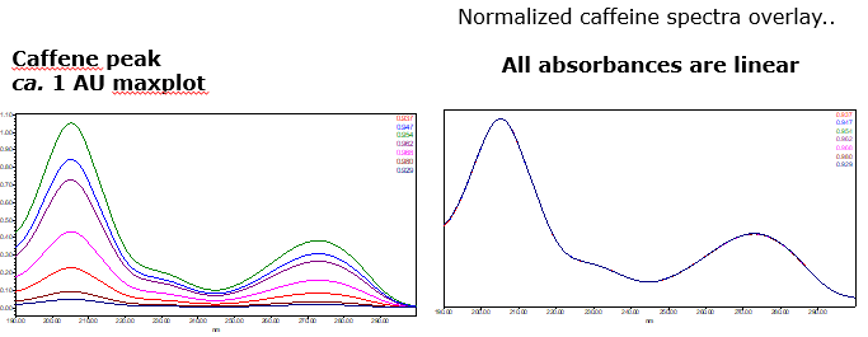
Therefore, to minimize the effects of photometric error for the spectral contrast math used to determine Peak Purity, the maximum spectral absorbance of a compound should be less than 1.0AU (figure 8).
STEP 5
A 5% error in linearity can have a profound effect on Peak Purity results (figure 9).
ADDITIONAL INFORMATION
Final Note: This can be done with either the Pro or QuickStart interface.