Validation Protocols: Reviewing Results of a Validation Study - Tip197
Article number: 117408
OBJECTIVE or GOAL
Get Empowered: Method Validation Manager
Tip #197: Validation Protocols: Reviewing Results of a Validation Study
The previous tip described how to carry out a validation study.
This tip explains how to review the results of a validation study.
When you perform the Validation Process step, a number of calculations are performed, including many statistical calculations. We will review some of the results generated in last week's tip.
ENVIRONMENT
- Empower
PROCEDURE
- Let’s start by reviewing the results for the Linearity test. Highlight the test and click the Review Validation Result(s) tool.

- The Validation Review window opens and displays the results for the System Precision test. Selecting the System Precision tab displays the "mean for area" and the "retention time". (Refer to Tip #192 for more details on the System Precision Test.)

- The Data tab displays the individual values for the six injections.

- Select the Linearity test in the tree. The Linearity Result tab displays the equation for the line. There are a variety of plots available, including Linearity Plot (amount or concentration versus response) and Regression Plot (level versus residual).

- The Data tab displays the Response Factor and the ‘Relative Response Factor. The response factor is simply the response (y value) divided by the amount or concentration of the analyte (x value), as seen in the table. The relative response factor is the response factor divided by the slope of the calibration curve.

- The Regression Coefficient tab displays the slope.

- Looking at another validation study, you can see that the Validation Result (VR) Status displays an exclamation mark in a yellow triangle for the Repeatability test, indicating a problem with the validation results.

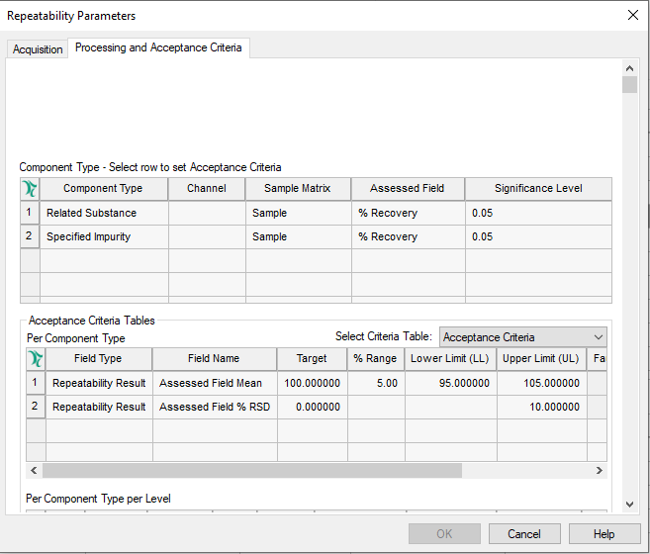
- Before looking at the validation results for this test, let’s first look at the acceptance criteria entered when the test was configured. The range for the average percent recovery is 95% to 105%. The %RSD for this field has an upper limit of 10%.
- In the Validation Review window, you can easily see the problem. The average percent recovery for Impurity A is 105.621088%, clearly above the upper limit of 105%.

ADDITIONAL INFORMATION
Use the Pro interface when working with the Method Validation Manager option.