How to use information displayed in the Mass Analysis window - Tip103
Article number: 57465
OBJECTIVE or GOAL
Welcome back to Get Empowered! In the last Empower tip-of-the-week post for Empower Chromatography Data Software, we did a quick ‘year in review’ of topics discussed in 2018 and answered a few commonly asked questions (Tip #102).
This week, we will continue our series on working with ACQUITY QDa MS data in Empower (Part 3).
- #100: How to view the base mass and mass spectra for the peaks in a chromatogram
- #101: How to work with 2D ACQUITY QDa MS data
In Tip #100, we briefly looked at the Mass Analysis window. Today, let’s take a closer look at the specific spectral information displayed in the Mass Analysis window.
Let’s get started.
ENVIRONMENT
- Empower
PROCEDURE
- Picking up where we left off in the at the end of Tip #100, let’s identify the various parts of the window and the default displays (figure 1).
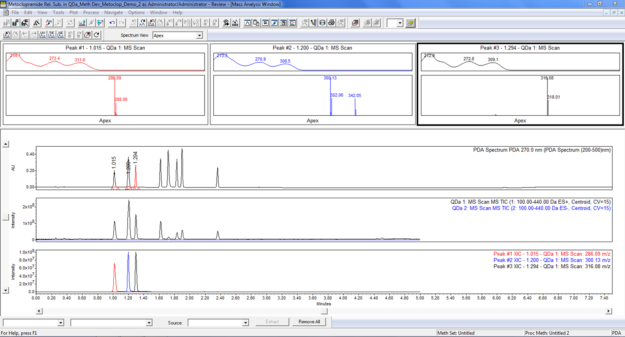
Figure 1
- The ‘Combined from the Spectrum View menu’, displays the ‘Apex Spectrum’ and the ‘Combined Spectrum’ for every integrated peak (figure 2).
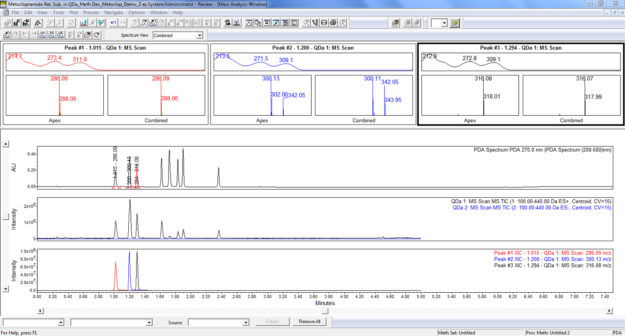
Figure 2
- The ‘Combined Spectrum’ is an averaged spectrum taken across a section of the peak which enhances the Signal to Noise ratio. This section of the peak is determined from the ‘Combined Peak Spectra % Peak Height Threshold’ which is set on the MS 3D Channel tab of the Processing Method. If we set that to ‘0’, Empower uses all of the spectra from peak start to peak end. If we set that to ‘30’, Empower uses the spectra from 30% of the peak height (figure 3). (The default value when making a new Processing Method is 10.)
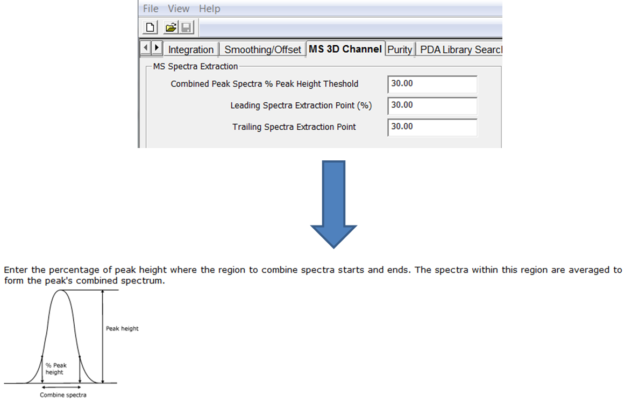
Figure 3
- Selecting ‘Purity’ from the Spectrum View menu shows the ‘Leading Edge Spectrum’, ‘Apex Spectrum’, and ‘Trailing Edge Spectrum’ for every integrated peak (figure 4).
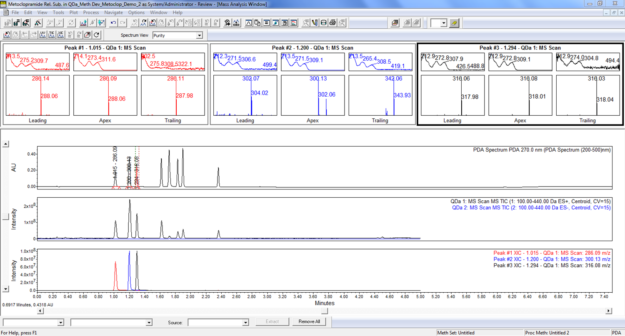
Figure 4
- Viewing the spectra in this way provides evidence of peak homogeneity. The points at which Empower takes the ‘Leading’ and ‘Trailing Edge Spectra’ are determined from the ‘Leading Spectra Extraction Point (%)’ and the ‘Trailing Spectra Extraction Point’ which are set on the MS 3D Channel tab of the Processing Method. If we set the Leading Spectra Extraction point to ‘0’, Empower takes the spectrum at peak start. If we set the value to ‘30’, the spectrum is taken 30% of the way from peak start to the retention time of the peak. The same is true of the ‘Trailing Spectra Extraction Point’ (figure 5). We can see the spectra for the second peak at 1.2 minutes are not consistent across the peak.
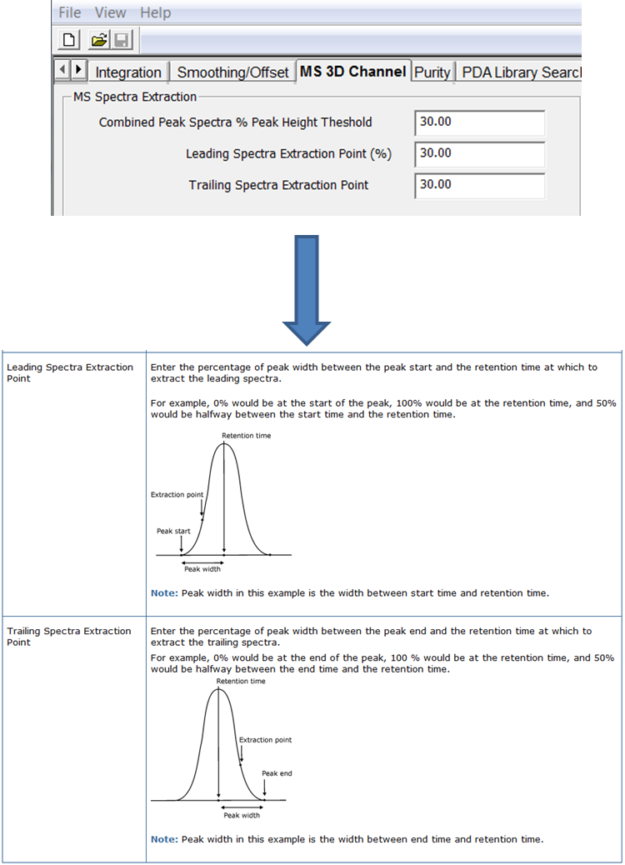
Figure 5
It’s that easy!
ADDITIONAL INFORMATION
Final notes:
- This procedure can be followed using the QuickStart or Pro interface.
- ACQUITY QDa Mass Detector is compatible with the Alliance HPLC system.
id57465, EMP2LIC, EMP2OPT, EMP2SW, EMP3GC, EMP3LIC, EMP3OPT, EMP3SW, EMPGC, EMPGPC, EMPLIC, EMPOWER2, EMPOWER3, EMPSW, SUP