How to overlay chromatograms in a single plot in a report method in Empower - WKB4705
Article number: 4705
OBJECTIVE or GOAL
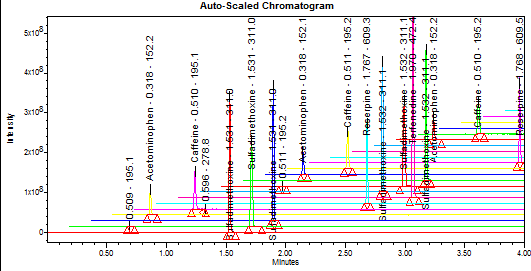
How to overlay and stagger chromatograms in a single plot in a report method in Empower.
ENVIRONMENT
- Empower 3
PROCEDURE
- Right-click a result set or results and select Preview Publisher.
- Choose the appropriate report method.
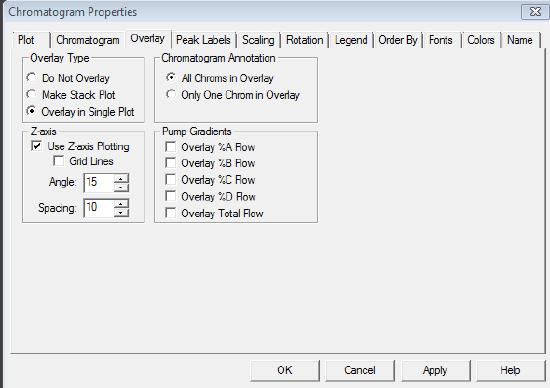
- Right-click the chromatogram and select Chromatogram Properties.
- Go to the Overlay tab.
- For Overlay Type, select Overlay in Single Plot.
- Chromatogram Annotation, select All Chroms in Overlay.
- For Z-axis, select Use Z-axis Plotting.
- Click Apply and OK.
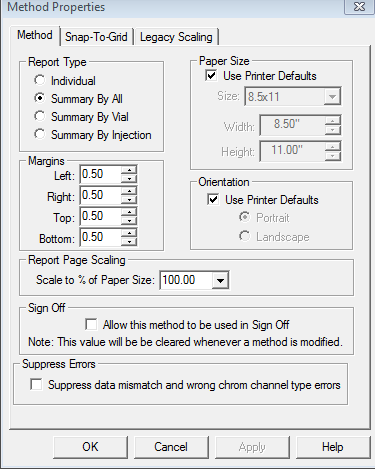
- Next, right-click in a blank space in the report method and select Method Properties.
- For Report Type, select Summary By All and this will stagger the peaks inside the chromatogram.
ADDITIONAL INFORMATION
id4705, EMP2LIC, EMP2OPT, EMP2SW, EMP3GC, EMP3LIC, EMP3OPT, EMP3SW, EMPGC, EMPGPC, EMPLIC, EMPOWER2, EMPOWER3, EMPSW, SUP