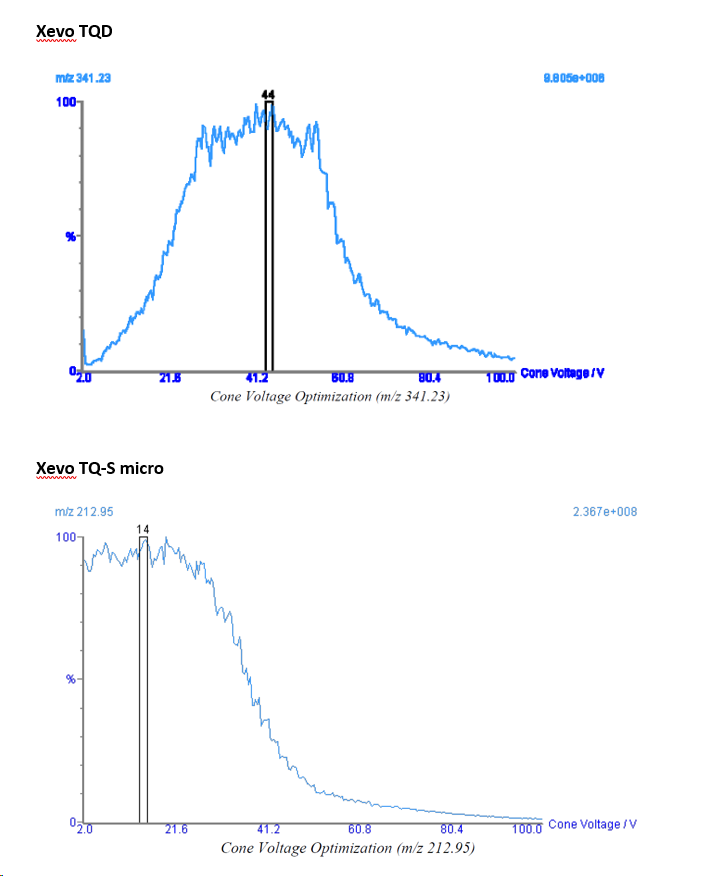
Cone Voltage Optimization plots in the IntelliStart method development report are very different for the Xevo TQD and the Xevo TQ-S micro - WKB58726
Article number: 58726
SYMPTOMS
- Cone Voltage Optimization plots in the IntelliStart method development report are very different for the Xevo TQD and the Xevo TQ-S micro
- Both plot response versus cone voltage from 2 V to 100 V
- The Xevo TQD response trace has the appearance of a chromatographic or spectral trace with a clear apex
- The Xevo TQ-S micro response trace has a plateau from 2 V to about 25 V and then drops off as the voltage increases; no clear apex
ENVIRONMENT
- Xevo TQD
- Xevo TQ-S micro
- MassLynx
- IntelliStart
- Sample Tune and Develop Method
CAUSE
This is expected behavior and not due to a software bug.
FIX or WORKAROUND
There is no fix or workaround.
ADDITIONAL INFORMATION
The Cone Voltage (CV) Optimization traces on the Xevo TQD and the Xevo TQ-S micro look different because of the StepWave. For the system that uses the StepWave, the cone voltage has far less effect on the response of the ions, especially at low voltages.
id58726, XEVOTQD, XEVOTQDIVD, XEVOTQSMIC