What do the different chromatographic peak integration color fillings mean in UNIFI? - WKB81085
Article number: 81085
ENVIRONMENT
- UNIFI
ANSWER
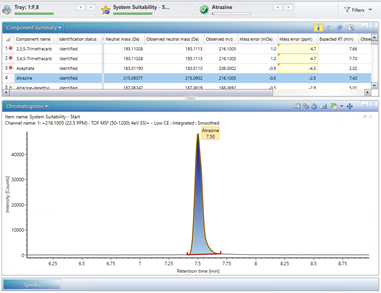
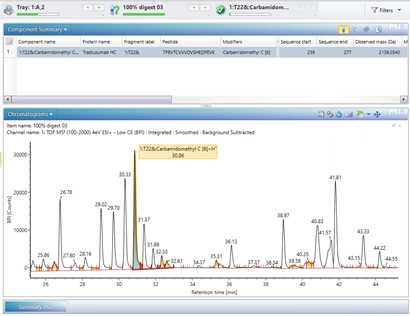
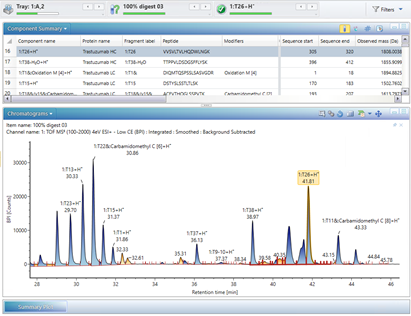
- A peak for an identified component is displayed with a blue filling.
- A peak for an identified component exceeding the limit faults criteria (set by the user in the analysis method) is displayed with a red filling.
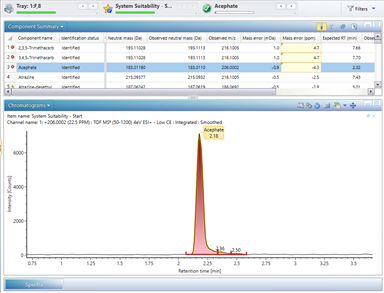
- A peak for an unidentified component is displayed with an orange filling.
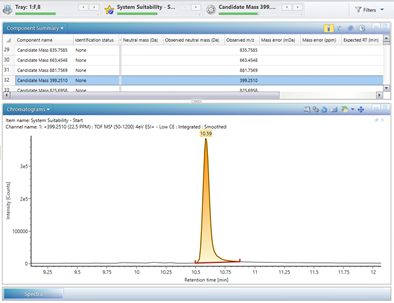
- A peak for a "discovered component" is displayed with a green filling. Note: On a "discovered component", the user can configure protein assay (SEC) and glycan assay (FLR) analyses to identify and discover compounds using a separation calibration curve.
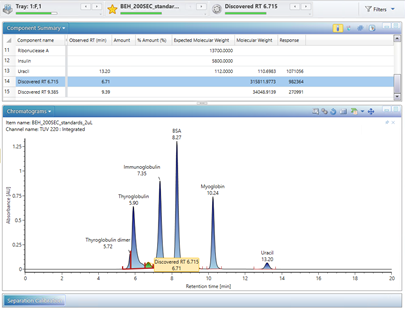
- A peak for an identified component that is filtered out from the component summary table is displayed with a white filling.
- If all filters are removed, all integrated peaks are displayed in red (if limits are set in the method), blue, and orange.
ADDITIONAL INFORMATION