How to calculate Retention Index (RT Index) and Retention LogP (RT LogP) in MassLynx - WKB99501
OBJECTIVE or GOAL
Calculate Retention Index (RT Index) and Retention LogP (RT LogP) in MassLynx.
The Retention Index is used to compare results from different LC systems and
different columns. LogP is a measure of hydrophobicity.
ENVIRONMENT
- MassLynx
- ChroTool.exe
PROCEDURE
To set up the Retention Index Table:

- Select Edit Index Table from the Retention Index option on the
Chromatogram Tools menu. - A set of values is supplied with the standard compound; enter these
values in the table.- To add an entry type in a Retention Index and LogP value supplied with the
standard compound, press the Add button. - To modify an entry, click on an entry in the list,
change the values, and press the Modify button. - To delete an entry, click on an entry in the list and
press the Delete button. - Pressing the Sort button sorts the list in order of ascending Retention
Index.
- To add an entry type in a Retention Index and LogP value supplied with the
- Run the standard compound to assign real times to the Retention Index
values.
To delete the Retention Index Table:
- Choose Delete Index Table from the Retention Index option on the Chromatogram Tools menu.
- At the prompt, press Yes to delete the Retention Index Table.
To make a Retention Index Calibration:
- Disable smoothing and integrate the chromatogram.
- Choose Make Calibration from the Retention Index option on the Chromatogram Tools menu.
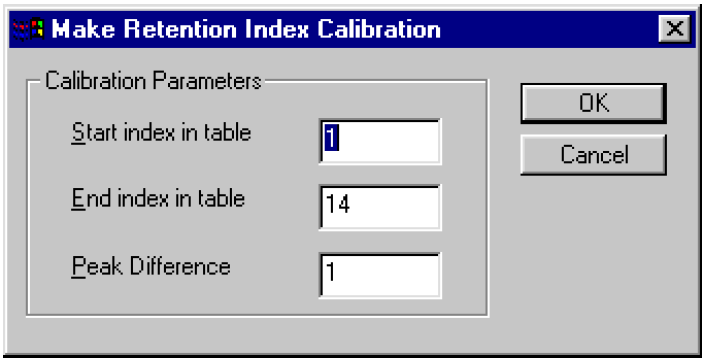
Start index in table
To calibrate over the same range as the standard, set this value to
1. To calibrate over a different range, enter the number of the entry in the Retention
Index Table at which to start.
End index in table
To calibrate over the same range as the standard, set this to
the number of the last entry in the Retention Index Table. To calibrate over a
different range, enter the number of the entry in the Retention Index Table at which
to end.
Peak Difference
This is normally set to 1 to measure all the peaks. If small
secondary peaks appear, you can set the Peak Difference to a higher number so that
the secondary peaks are not used in the calibration.
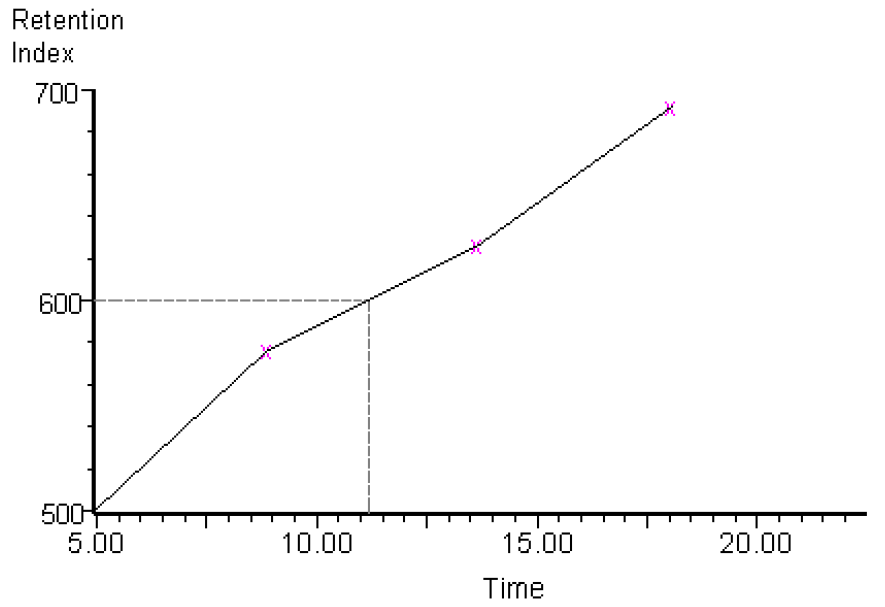
When a Retention Index calibration is performed, MassLynx matches peaks in the
trace with those in the Retention Index Table and assigns a real time to the
Retention Index value. MassLynx then interpolates the results and displays
Retention Index values for each peak in the chromatogram trace.
To Display Retention Index values on a Chromatogram:
Select View from the Display menu and check the Peak List box.
To Check Retention Index Calibration Status:
Select Calibration Status from the Chromatogram Tools menu.
If calibration has been performed, then this dialog is displayed:

Otherwise, this dialog appears:

ADDITIONAL INFORMATION
Example data:
V50 from default.pro with limited integration area to 20000. Note that there are no RT Index or RT LogP values.

With a calibration: Note that there are RT Index and RT LogP values.

V50 Processed using default LC.olp in OpenLynx. Note RT Index and RT LogP values.
