TargetLynx calibration plot displays incorrect values for QC samples when a "user factor" is used in the sample list - WKB81655
Article number: 81655
SYMPTOMS
- In theory, "user factors" are applied only to analyte samples, but it also works well for other sample types, such as QC or Recovery samples. When applying "user factors" in the sample list, TargetLynx correctly reports the final concentration and the concentration deviation wen it is a "known sample" like a QC.
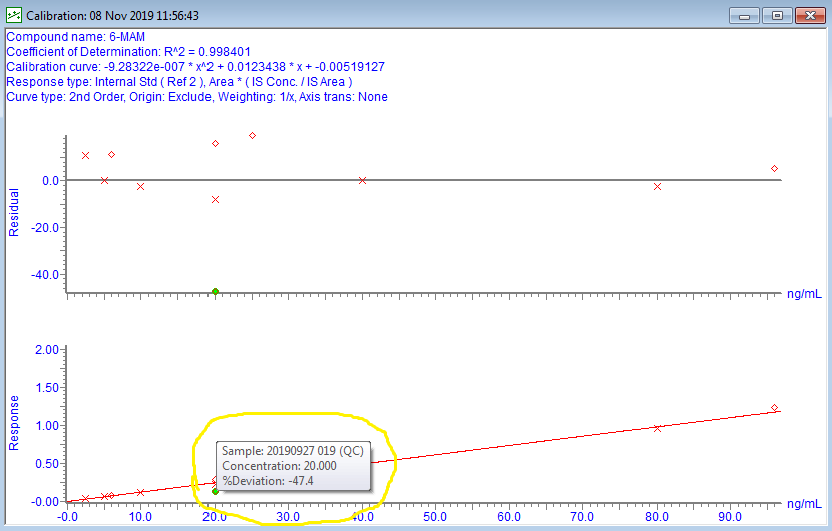
- Although the concentration deviation is displayed correctly in the TargetLynx summary table, both the response curve and the residuals plot display incorrect concentration deviation values for QC samples.
- This issue is observed in different versions of MassLynx.
ENVIRONMENT
- MassLynx
- TargetLynx
CAUSE
The reason is unknown so far
FIX or WORKAROUND
There is currently no fix or workaround.
Note that this is only a graphics issue. The calculated residuals values are correctly displayed in the summary table.
ADDITIONAL INFORMATION
As seen in the screenshot below, the sample in row 17 has a "user factor" of 2 and a good %Dev value of 5.1%. However, this point is displayed incorrectly in the residuals plot and in the response curve.
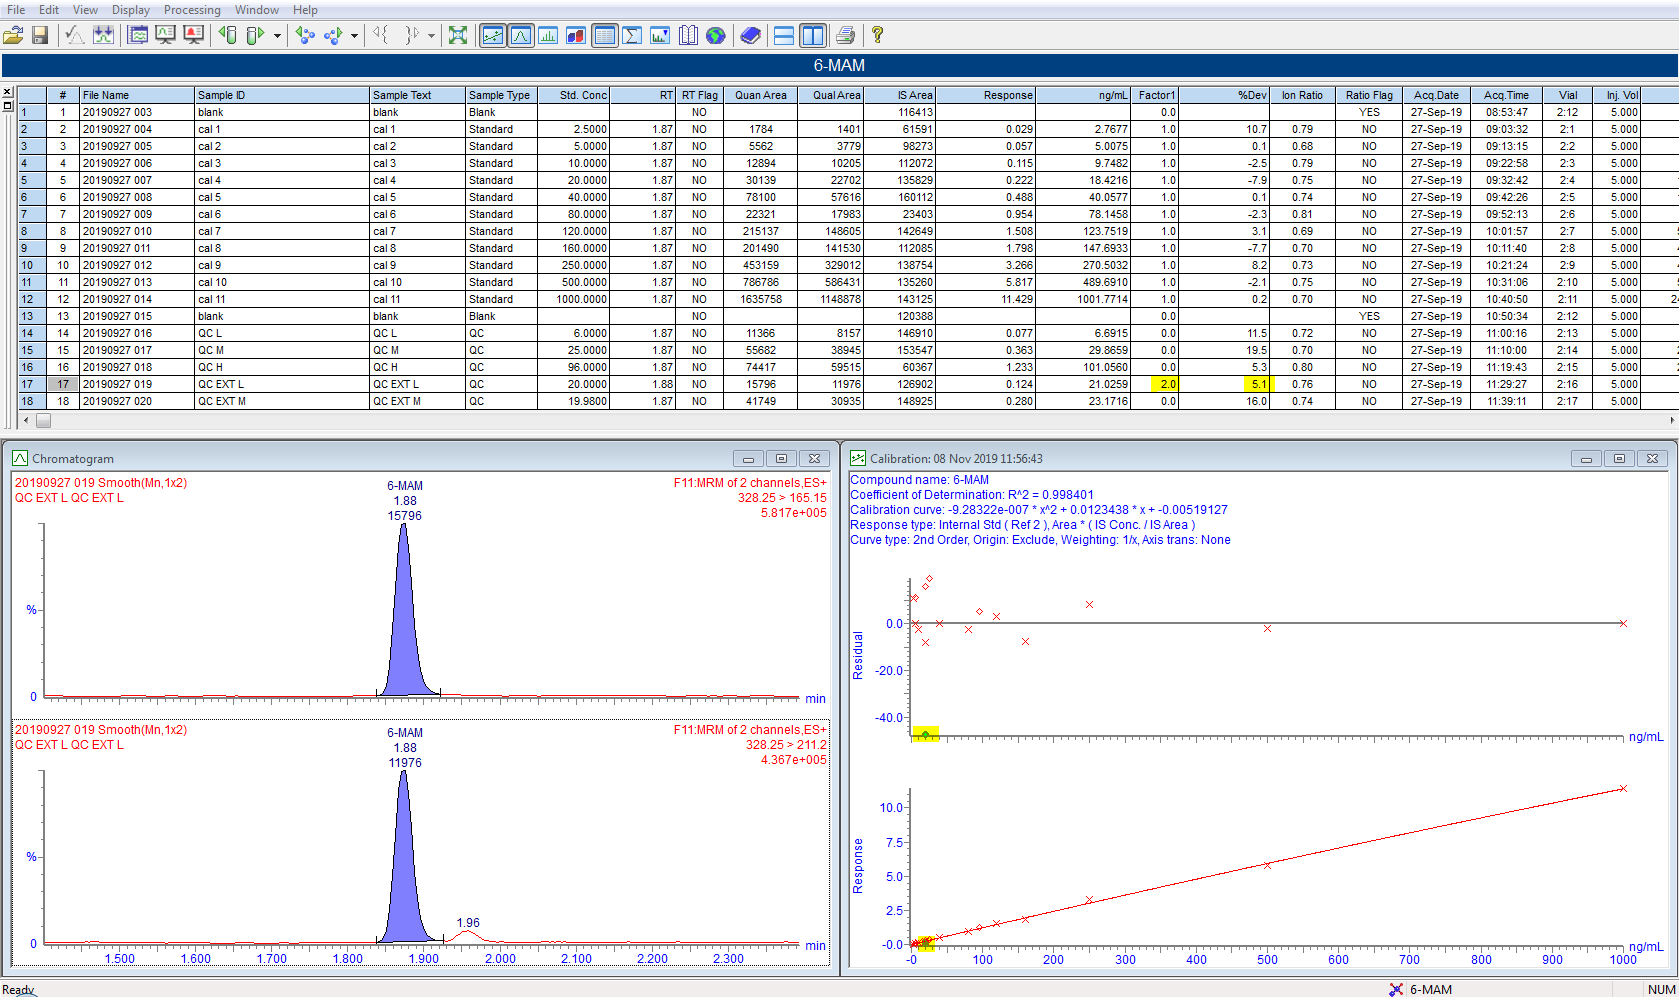
When the sample is highlighted either in the residuals plot or in the response curve, a pop-up window appears which also shows an incorrect concentration deviation.
id81655, MLYNX, MLYNXV41, SUPMM, TARLYNX41