How to display an MRM or SIR trace in MassLynx and integrate the peaks - WKB125716
Article number: 125716
OBJECTIVE or GOAL
Display an MRM or SIR trace in MassLynx and integrate the peaks.
ENVIRONMENT
- MasslLynx 3.x
- MassLynx 4.x
PROCEDURE
- Highlight the sample of interest on the MassLynx sample list (see Figure 1).
- Click on Chromatogram at the top of the sample list to open the raw data file (see Figure 2).
- Note: The data initially shows the Total Ion Chromatogram for the first function in the raw data file.
- If the time range in the x axis is incorrect or "zoomed" in, click on the crossed arrows button on the tool bar.
- To display the MRM channel of interest, go to Display > Mass from the menu (See Figures 3 and 4).
- If there are multiple functions in the data file, select the appropriate function from the Functions pull-down menu.
- Double-click the specific MRM (or SIR) trace or traces to be displayed in the Channels field.
- The channels to be displayed appear in the Description (chan) field.
- Click OK.
- If multiple traces were opened, select the trace of interest by clicking on that Chromatogram (see Figure 5).
- Note: The selected chromatogram is indicated by a colored square matching the color of the trace to the left of the chromatograms.
- To integrate the trace, go to Process > Integrate from the menu (see Figures 6).
- Select the method of integration: ApexTrack Peak Integration (checked) (see Figure 7) or Standard Integration. (ApexTrack unchecked) (see Figure 8).
- Enter or select the appropriate parameters for Noise/Peak width, Smoothing, Integration (Peak Detect), and Threshold.
- Click Integrate to process the selected chromatogram.
- Click Quit to close the Integrate Chromatogram dialog.
ADDITIONAL INFORMATION
Figure 1: MassLynx sample list

Figure 2: Open Chromatogram

Figure 3: Display > Mass

Figure 4: Mass Chromatogram

Figure 5: Multiple Chromatographic traces

Figure 6: Process > Integrate
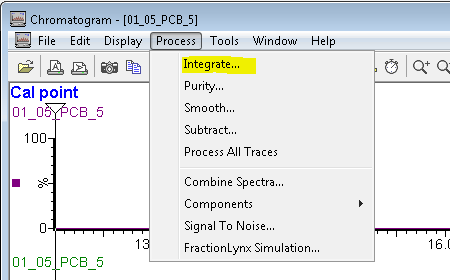
Figure 7: Integrate Chromatogram (ApexTrack enabled)

Figure 8: Integrate Chromatogram (Standard Integration, ApexTrack disabled)

id125716, MLYNX, MLYNXV41, SUPMM