How to Work with the System Suitablity Option (Part 6) - Tip73
OBJECTIVE or GOAL
 Welcome back to Get Empowered! In our last tip-of-the-week blog for Empower Software, we learned about about Acceptance Criteria Limits in the Processing Method (Tip #72)
Working with Empower Software’s System Suitability option:
- #68: Statistical Moments
- #69: How Peak-to-Peak Noise is calculated
- #70: How Baseline Noise and Drift are calculated
- #71: How Detector Noise and Drift is calculated
- #72: Acceptance Criteria Limits in the Processing Method
In this week’s tip, we are going to learn how to create Control Charts using System Suitability (Part 6).
In Tip #27, we learned how to use the Suitability Limits to flag results which are outside of a desired range. An added benefit to using this feature is the ability to create Control Charts, which show you trends in your data over time. Whether you are in a QC lab and need to track the amount of active in each batch that ships, doing Method Development and need to track the number of injections you get out of a column, or if you are a process chemist tracking the completion of a reaction, this is a great visual tool. And – it is easy to do.
Let me show you how it is done.
ENVIRONMENT
- Empower
PROCEDURE
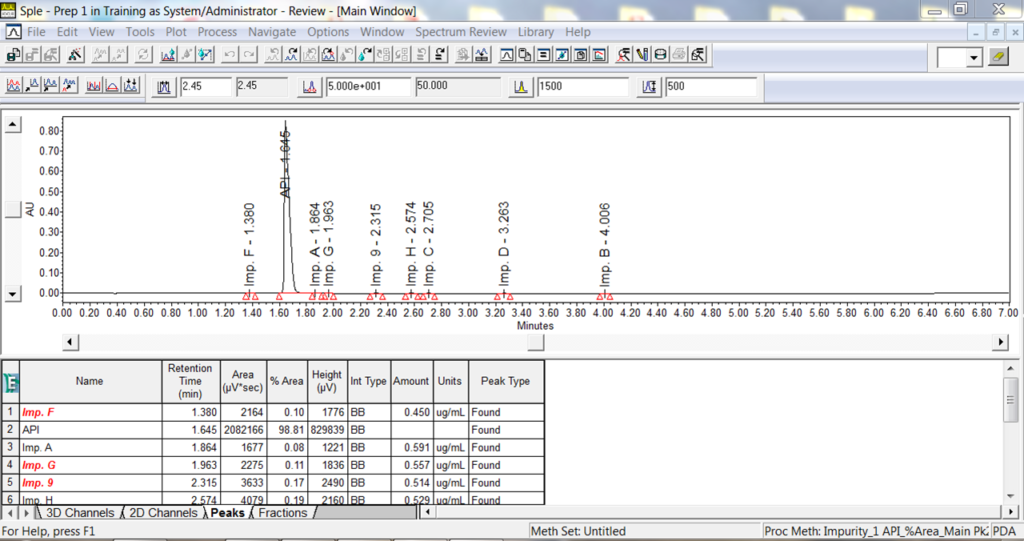
- We begin by bringing a Channel into Review, open a Processing Method, and Integrate/Quantitate (Figure 1). In this case, our goal is to set up a control chart to track the Amount of Imp. F in our samples.
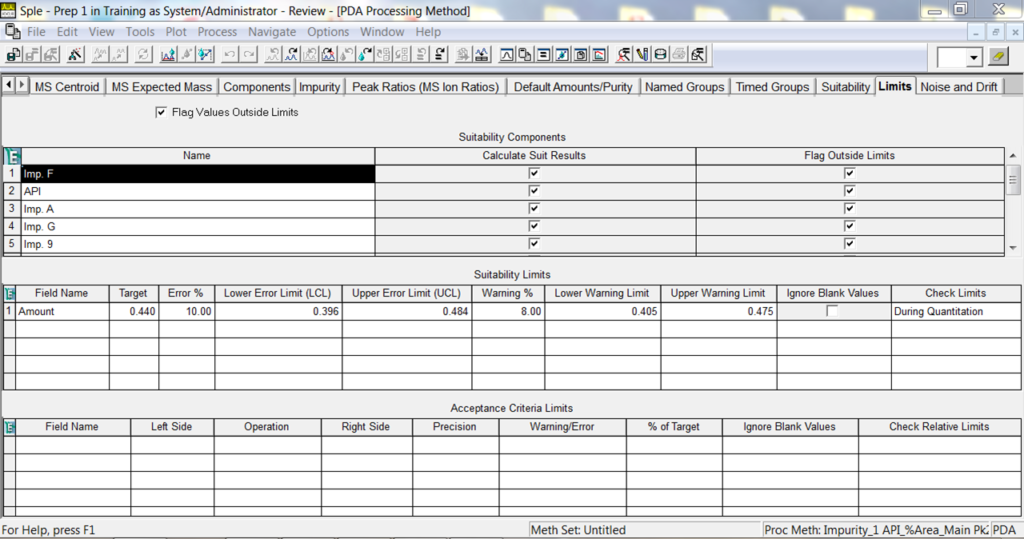
- Go to the Processing Method window, click the Limits tab, and highlight Imp. F in the Suitability Components table. Then click in the Field Name in the Suitability Limits table and select Amount, set the Target value, set the Lower and Upper Error Limits, and set the Lower and Upper Warning Limits.
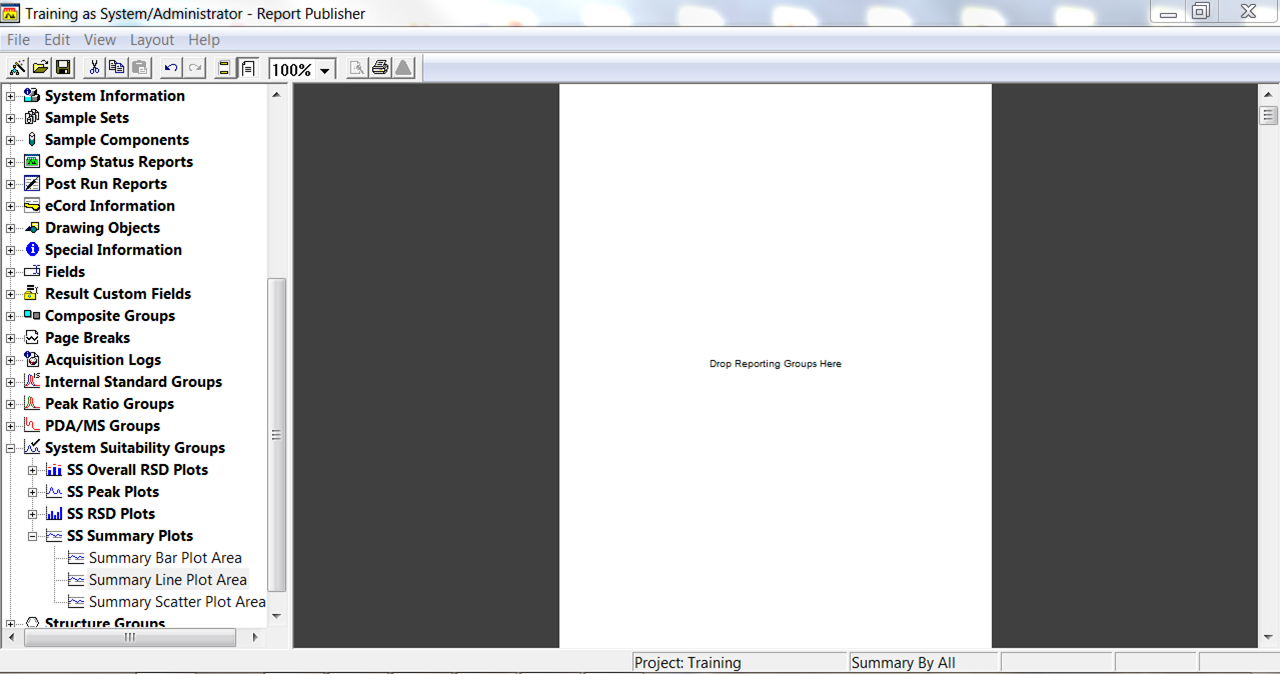
- Process the Sample Set and then select the results for the samples and bring to Preview/Publisher. Create a Summary by All Report Method and from the System Suitability Groups – drill down and double-click on the group called Summary Line Plot Area.
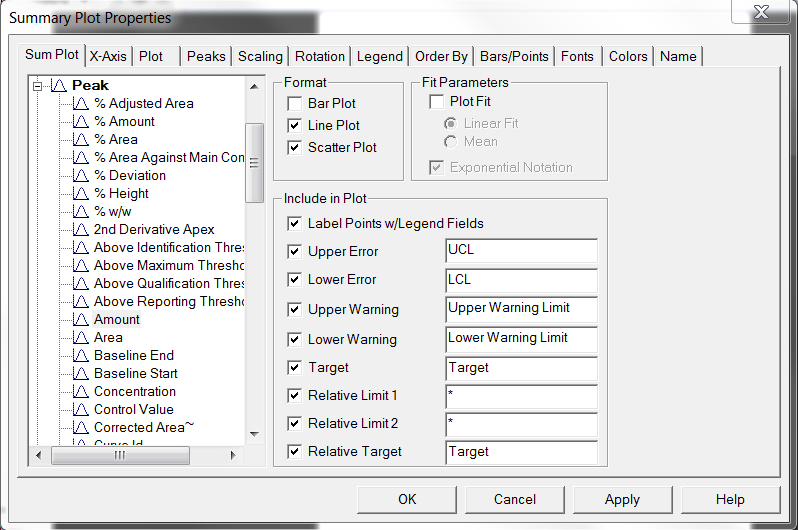
- In the properties of the group, change the Sum Plot from Area to Amount.
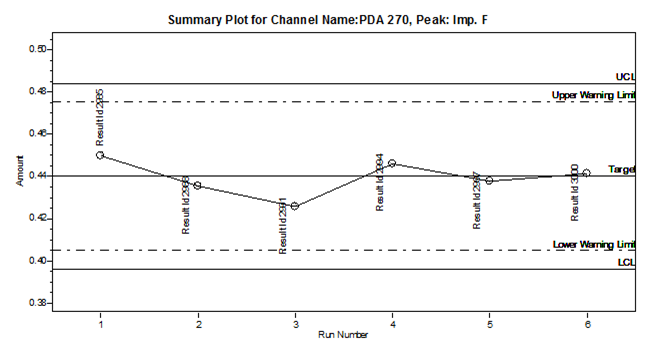
- Preview the results and we see the control chart for the Amount of Imp. 4 with both warning and error limits marked on the chart (Figure 5). In this case, the Amount for this impurity is hovering around the target value.
It’s that easy!
If you would like to know how to filter the report so only the Control Chart for the one peak is included, stay tuned for a future tip which addresses just that.
ADDITIONAL INFORMATION
This procedure can be followed using the QuickStart or Pro interface.