Processing Methods: using correct portions of the Processing Method - wkb258607
OBJECTIVE or GOAL
Understanding which portions of the Processing Method to use
ENVIRONMENT
- Empower
- Empower Tip of the Week #322
PROCEDURE
It depends on the type of data you are working with and what your chromatographic method/SOP calls for to determine which portions of the Processing Method you should use while creating Processing Methods.
For example, let us assume the user is working with either 2D LC or 2D GC data, needs to quantitate analytes of interest, and requires some system suitability calculations.
STEP 1
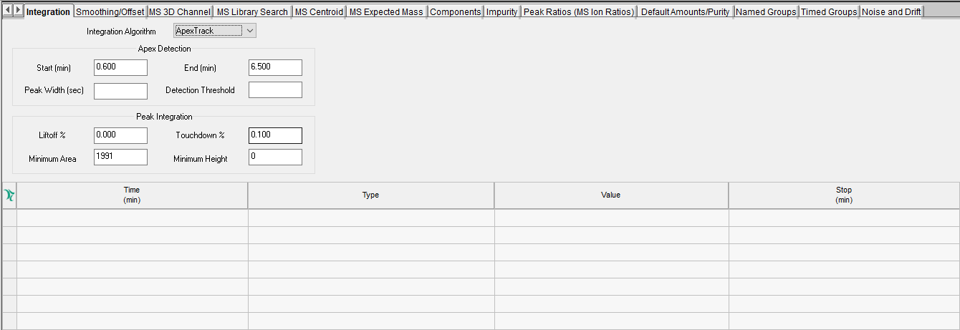
Start with the Integration tab. Whether you use Apex Track or Traditional, I recommend determining which part of the chromatogram needs to be integrated and then optimizing peak width and threshold. Depending on the chromatography, you may need to add some timed events to optimize peak detection and/or integration in some portions of the chromatogram (figure 1).
STEP 2:
The Smoothing/Offset tab is used for two things, either applying a smoothing factor for excessively noisy baselines or if you collect multiple channels of data per injection and want to line up the peaks between the channels, a time offset applied to one of the channels will accommodate that need (figure 2).

STEP 3
The Components tab is used for identifying your peaks with names and/or labels, expected retention times, and retention time windows. Calibration options include the following fields – X Value, Y Value, Fit, and Weighting. There is the option for Internal Standard which is commonly used in GC methods. There are many other fields in this table including relative retention time peak, and CCompRef peaks & CConst values which are used with custom fields (figures 3 & 4).


STEP 4
For analyzing impurities, the Impurity tab is used to define the impurity response, the ICH thresholds, grouping impurities of a common component type together and setting separate limits for potentially toxic impurities (figure 5).

STEP 5
The Peak Ratios tab provides a simple way of calculating the ratio of peak response in one channel to peak response in another channel. Although the tab says MS Ion Ratios, this function can be used for any 2D data from any detector (figure 6).

STEP 6
Amounts for standard components along with purity factors can be entered on the Default Amounts/Purity tab. This is an alternative to entering this information in the Component Editor either in Run Samples or Alter Sample (figure 7).

STEP 7
There are two ways to group peaks together to have Empower calculate a sum total of those peaks. This can be done by name, whereby named peaks are added to the group or by time, where you specify a time range over which peaks will be grouped together (figure 8).

STEP 8
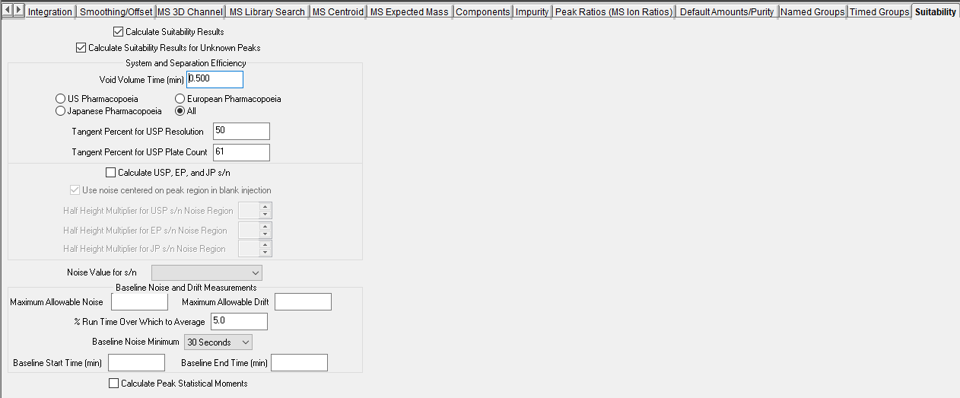
Most methods call for some type of System Suitability measurements. System Suitability calculations such as Plate Count, Resolution and Tailing Factor will be done by enabling Suitability Results and entering a Void Volume Time. Other options include signal-to-noise ratio calculated in a variety of ways (figure 9). This requires the System Suitability option which needs to be purchased and installed.
STEP 9
The Limits tab works in conjunction with the Suitability tab and is part of the System Suitability option. Limits can be set for peak fields including system suitability fields and custom fields. If the value for the selected field(s) falls outside of those limits, the peak will be flagged, and the result will be marked as Faulted (figure 10).

STEP 10
The Noise and Drift tab is used to have Empower calculate Detector Noise and Drift over a specified time region within the chromatogram (figure 11).

ADDITIONAL INFORMATION
This can be done with either the Pro or QuickStart interface.