Baseline Noise: A Summary of Noise - Tip300
OBJECTIVE or GOAL
Measure various categories of noise.
ENVIRONMENT
- Empower
- Tip of the Week #300
PROCEDURE
STEP 1
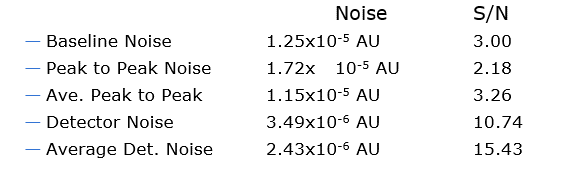
Using one chromatogram, you can see how the technique used to measure noise results in different values of noise being reported. Over a relatively flat baseline region you would expect Baseline Noise and Peak to Peak Noise to be similar, and the Detector Noise, the RMS value, to be considerably lower. Also, you can expect that the Average Peak-to-Peak Noise and the Average Detector Noise calculations will be somewhat smaller than their respective non-Averaged calculations. If we use Baseline Noise as our noise calculation of choice and set our LOD to be 3 times noise, then a peak having height of 3.75X10⁻⁵ AU would have a measured signal-to-noise value of 3. You can see how there would be some confusion if the same calculation were performed using one of the other noise techniques. For example, using Peak to Peak Noise for a 3.75X10⁻⁵ AU peak would calculate a signal-to-noise value of 2.18 (below the stated LOD of 3X signal-to-noise). Likewise, if you assume LOQ at 10 times noise, using Detector Noise or Average Detector Noise as the noise calculation would report quantified results for our peak at 3.75X10⁻⁵AU (Figure 1).
STEP 2
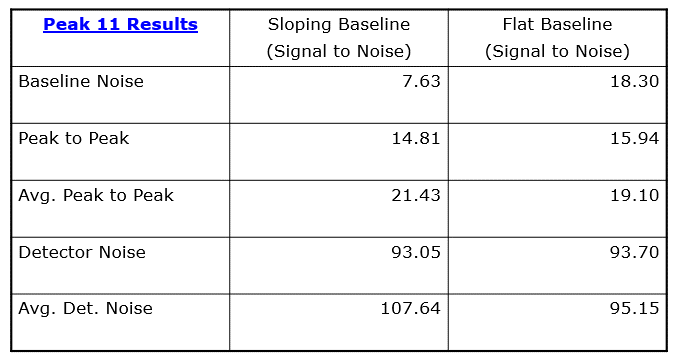
Measuring noise on the flat portion of the chromatographic baseline, you can see the resulting signal-to-noise calculations for the three peaks (Figure 2).

STEP 3
Measuring noise on a drifting portion of the chromatographic baseline, you can see that the resulting signal-to-noise calculations for the three peaks produce different values (Figure 3).

STEP 4
Even though all the displayed signal-to-noise calculations show some improvement when noise is measured over a flat portion of the baseline, as compared with that of a sloping portion of the baseline, none is as significantly different as Baseline Noise. If you want to use Baseline Noise for the determination of signal-to-noise, it is recommended that noise be measured on a non-sloping portion of the baseline so that baseline drift does not negatively impact the calculation. You can easily see that drift comes into play with all the calculations. When comparing the Detector Noise calculation with the average Detector Noise calculation, they are not all that different when noise is measured on a flat portion of the baseline, but they are largely different when measured on a sloping portion of the baseline. You can make a similar comparison to the Peak to Peak and Average Peak to Peak calculations. Although it is impossible to eliminate drift from the calculation of chromatographic noise, your choice of algorithms for measuring noise can have an impact. Understanding the calculations and how different chromatographic anomalies impact the noise calculation is important to the calculation of signal-to-noise. All the calculations described in this tip are acceptable and are used for the measurement of noise. Remember that when selecting USP Noise or any of the other pharmacopoeias, Empower defaults to Peak to Peak Noise for the signal-to-noise calculation (Figure 4).
ADDITIONAL INFORMATION
This can be done with either the Pro or QuickStart interface.