Signal-to-noise: Select noise from the "Noise Value for s/n" drop-down list - Tip296
OBJECTIVE or GOAL
Select noise from the "Noise Value for s/n" drop-down list.
ENVIRONMENT
- Empower
- Empower Tip of the Week #296
PROCEDURE
It is important to determine which signal-to-noise calculation is required. It can be the recommended calculation per the pharmacopoeia, or simply the signal-to-noise. Options are discussed below.
Calculating Noise from Within the Chromatogram
STEP 1
On the Suitability tab in the Processing Method, make the selection for signal-to-noise to be calculated. When selecting the pharmacopoeia calculation, Empower defaults to Peak-to-Peak noise. There is no need to select anything from the Noise Value drop-down list (Figure 1).

STEP 2
On the Noise and Drift tab, you need to select the portion of the baseline from which Peak-To-Peak noise will be calculated. Empower will calculate both Peak-To-Peak Noise and Average Peak-to-Peak Noise; therefore, enter both the time range for the portion of baseline and the segment width for the average noise calculation (Figure 2).

STEP 3
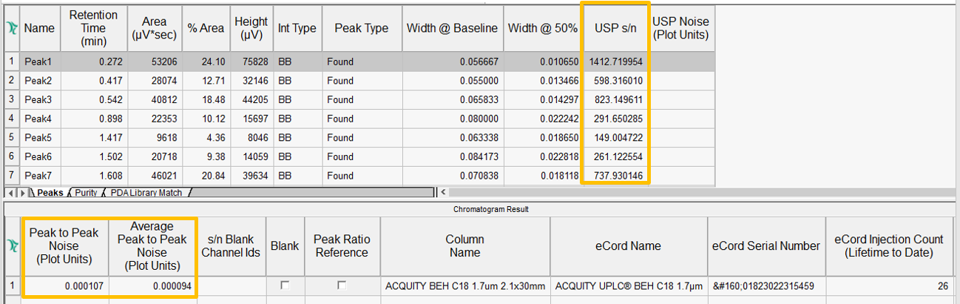
In the Results window within Review, you can see both the Peaks table and the Chromatogram Result table. The USP s/n has been calculated for every peak and the Peak-to-Peak noise, as well as the Average Peak-to-Peak noise. This Peak-to-Peak noise value is used for the calculation of s/n for each peak (Figure 3).
Calculating Noise from a Blank Injection
STEP 4
The recommendation from the USP is to use a blank injection from which noise will be calculated. Once again, Empower defaults to Peak-to-Peak noise, so there is no need to select anything from the Noise Value drop-down list. The noise value for each peak will be different because Empower calculates the Peak-to-Peak noise at the retention times of each peak in the blank. Empower uses a time range over which it calculates noise. The range is the width of each peak at half height multiplied by the Half Height Multiplier. The Half Height Multiplier default value for USP is 5 (Figure 4). (The USP has proposed a change to make the value 20 as of December 1, 2022.)

STEP 5
Stacking the blank with the chromatogram helps visualize where the noise is calculated. For example, there is a peak at 0.898 minutes. The width at half height is 0.022242 minutes. Multiplying that by 5 for the USP signal-to-noise gives us a window of 0.11121 minutes around the expected retention time in the blank from which Peak-to-Peak noise is calculated (Figure 5).

STEP 6
Be sure to select the blank by marking the check box in the Blank field within the Sample Set Method, or post-run in Alter Sample (Figure 6).

STEP 7
When the Sample Set is processed, the USP s/n and the USP Noise value for each peak are found in the Peaks table in Review (Figure 7).

Addressing Non-Pharmacopoeia Calculation of Signal-to-Noise
STEP 8
If you simply want signal-to-noise, there is a s/n field. Select the noise you want to use for this calculation from the "Noise Value for s/n" drop-down list. In this example, you are selecting Peak-to-Peak noise.
(Note: We will explore the other types of noise in subsequent tips) (Figure 8).

STEP 9
Go to the Noise and Drift tab to specify the time region for the noise calculation as described in Step 2. When the data is processed, you see the s/n field is populated, and the Peak-to-Peak noise field is populated as well (Figure 9).

ADDITIONAL INFORMATION
This can be done with either the Pro or QuickStart interface.