Calculating Amount/Concentration - Calibration Curve Fit Types: Linear Fits - Tip279
OBJECTIVE or GOAL
Calculate Amount/Concentration, Calibration Curve fit types and review Linear Fits.
ENVIRONMENT
- Empower
- Empower Tip of the Week #279
PROCEDURE
STEP 1
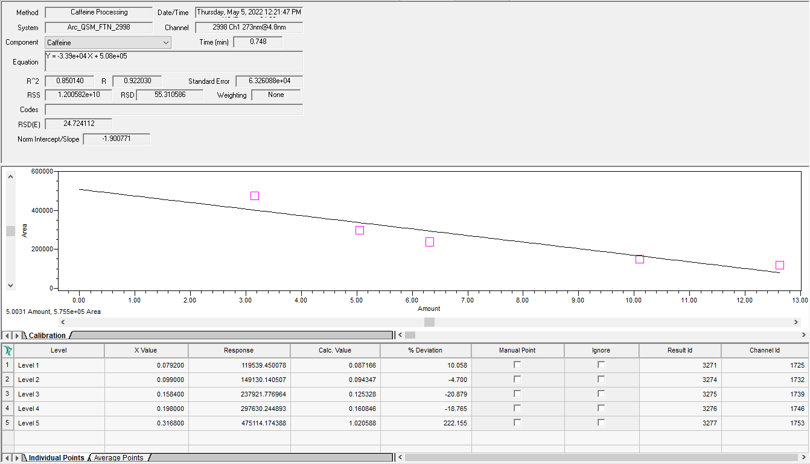
For a Linear Fit, Empower calculates the line that best fits the amount (or concentrations) versus the responses. The equation is Y = Bx + A, where B is the slope and A is the Y intercept (Figure 1).

STEP 2
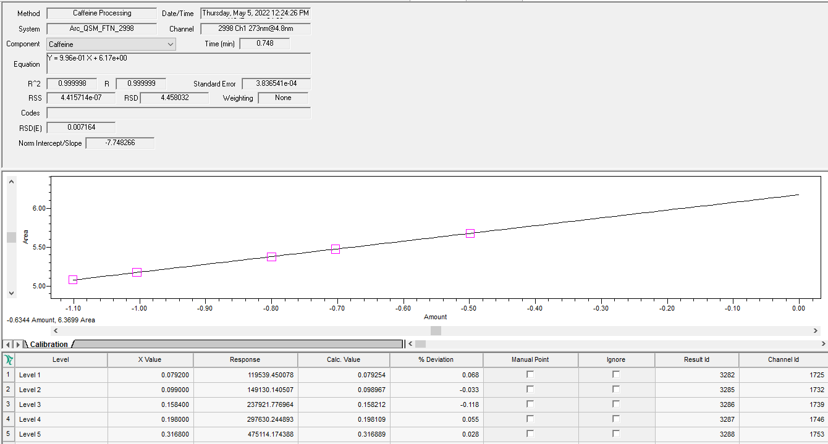
For an Inverse Linear Fit, Empower performs a Linear Fit to the X and Y values of the calibration points. The X value used in this case is 1/X for each standard peak. The equation used is the same as that for Linear Fit (Figure 2).
STEP 3
For a Log-Log Fit, Empower performs a Linear Fit to the X and Y values of the calibration points. The Y value of each point is the Log of the response of the peaks in the standard. The X value of each point is the Log of the amount or concentration of the peaks in the standard. The equation used is the same as that for Linear Fit (Figure 3).
STEP 4
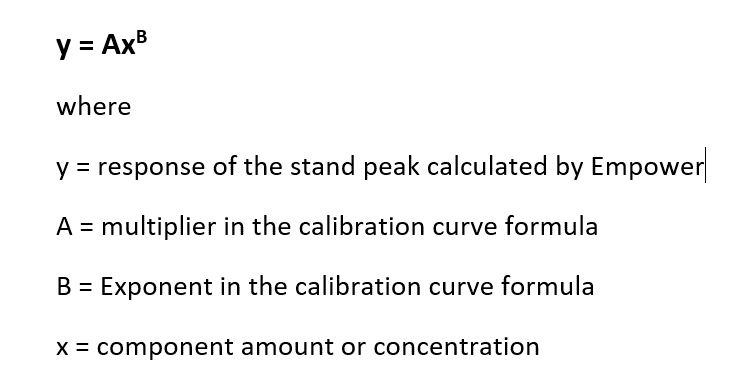
For a Power Curve Fit, Empower performs a Linear Fit of log Y versus log X, where Y is the response and X is the X value (Figure 4).

STEP 5
The plot and the equation of the curve are reported in terms of the X value and response (Figure 5).
ADDITIONAL INFORMATION
This can be done with either the Pro or QuickStart interface.