Modifying a Report's Print View from the Curves Tab - Tip249
OBJECTIVE or GOAL
Q: If I go to the Curves tab in the project window and right click ‘print’, how do I modify what is printed?
ENVIRONMENT
- Empower
- Empower Tip of the Week #249
PROCEDURE
STEP 1
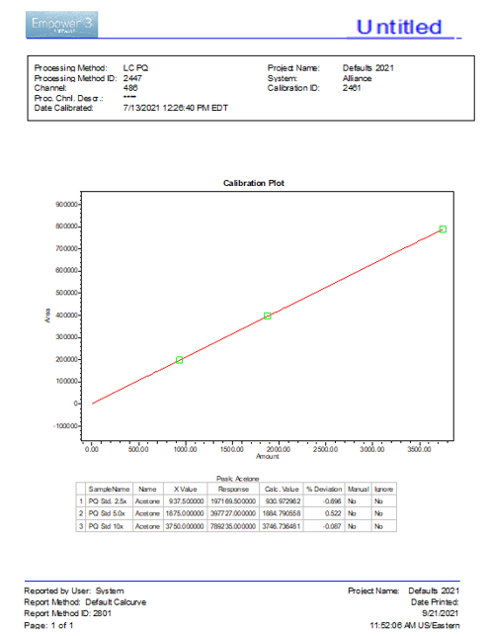
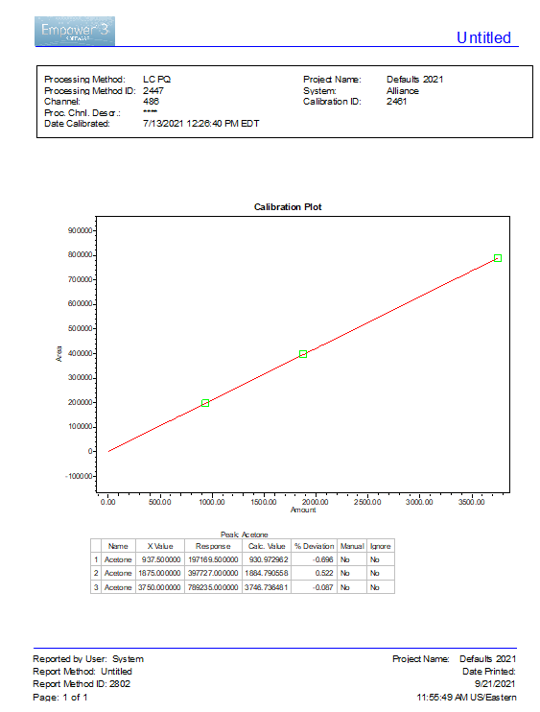
Right click on a calibration curve in the Curves tab and select ‘Print’, Empower will generate a report similar to what is in figure 1 (figure 1).
STEP 2:
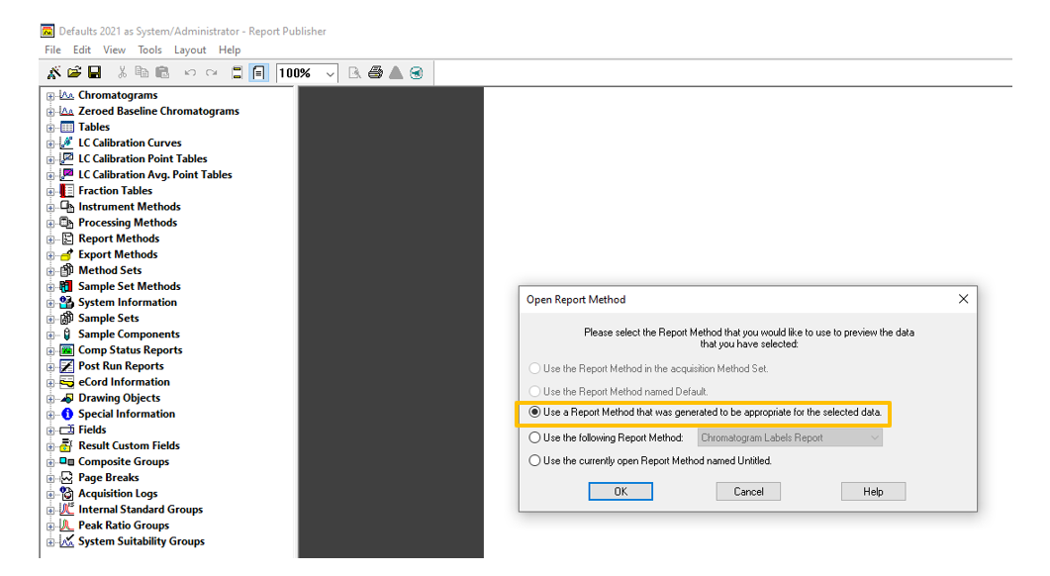
To modify what gets printed when printing in this way, right click on the calibration curve and select ‘Print/Preview’. When the dialogue opens, select the third choice which is ‘Use a report that was generated to be appropriate for the selected data’. Click ‘OK’ (figure 2).
STEP 3
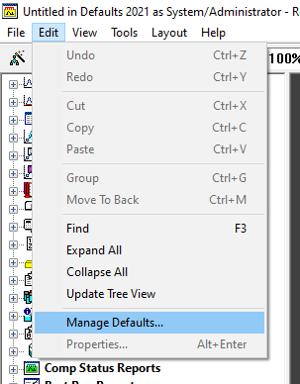
Close Preview and in the Report Publisher window, select ‘Edit’ > ‘Manage Defaults’ (figure 3).
STEP 4
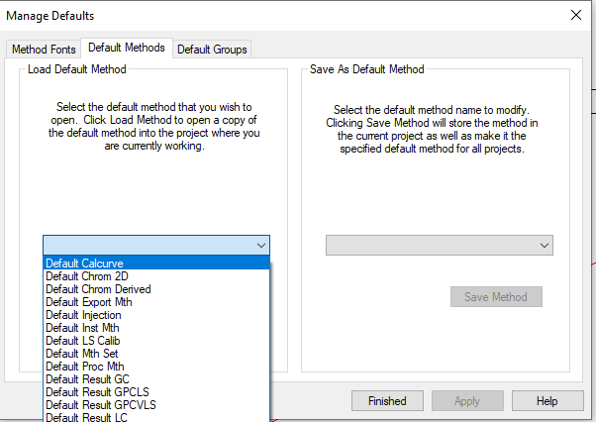
Select ‘Default Calcurve’ from the list on the left (figure 4).
STEP 5
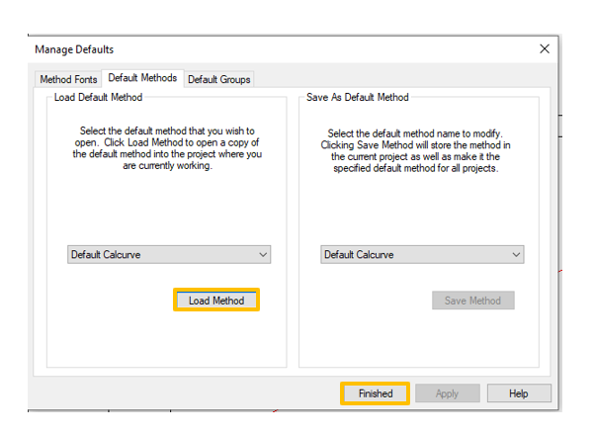
Click ‘Load Method’. Click ‘Finished’ (figure 5).
STEP 6
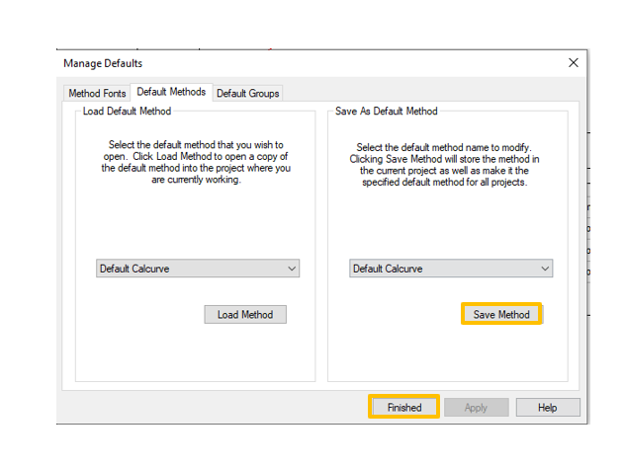
Make the changes, go back to ‘Edit’ > ‘Manage Defaults’ and click ‘Save Method’. Click ‘Finished’ (figure 6).
STEP 7
Now, if you right click on a calibration curve in the Curves tab and select Print, the report will be modified. In this example, I removed Sample Name (figure 7).
It's that easy!
ADDITIONAL INFORMATION
Final Note: This can be done with either the Pro or QuickStart interface.