Accessing Analytics dashboards in Empower - Tip216
Article number: 194258
OBJECTIVE or GOAL
Get Empowered: Empower Analytics
Tip #216: Accessing analytics dashboards in Empower
This tip discusses Empower Analytics. Empower Analytics provides key chromatographic performance dashboards: System Summary & System Usage for chromatographic systems, Project Usage, User Analysis (optional), and Methods Analysis. For example, it shows the amount of reprocessing and how often manual integration is done per project and per user. This information is useful to determine which methods could be optimized to reduce the need for manual integration and/or reprocessing.
ENVIRONMENT
- Empower
PROCEDURE
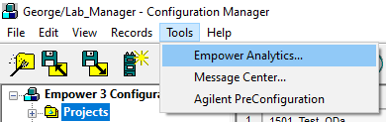
- In the Configuration Manager window, select ‘Empower Analytics’ from the Tools menu.
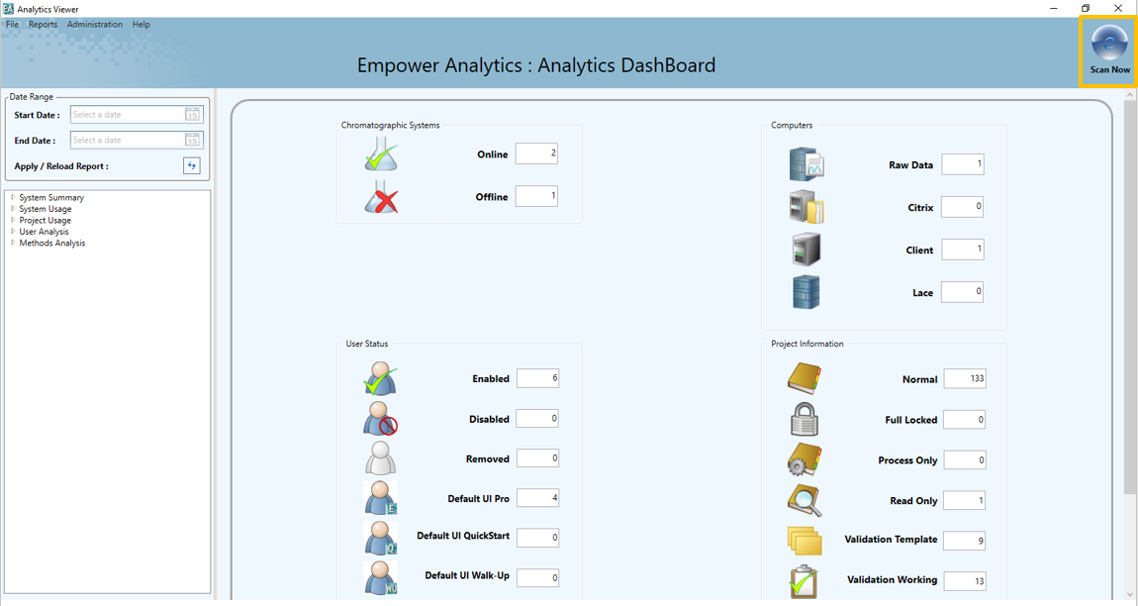
- The Analytics Dashboard opens and displays key information, such as the number of ‘chromatographic systems on-line’ and the ‘number of projects’. Click the ‘Scan’ button in the upper right-hand corner of the window.
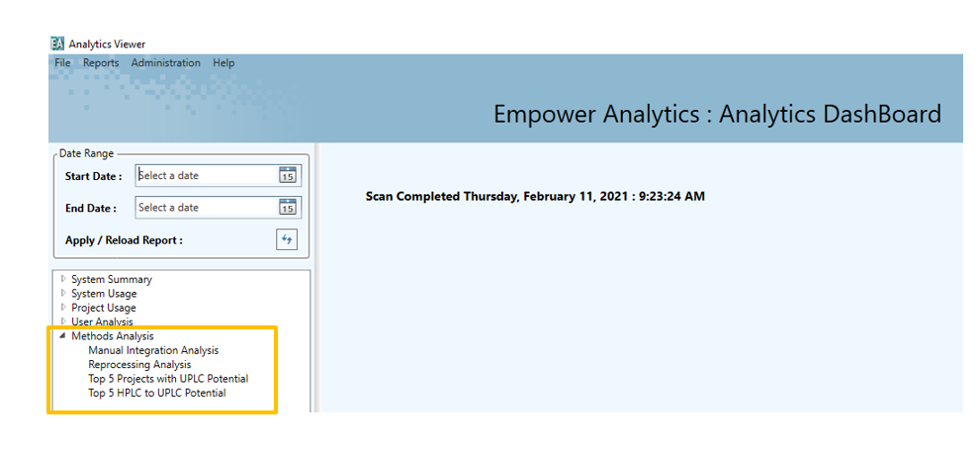
- Now, let’s look at reprocessed data in our projects. Frequent reprocessing of data could be due to older methods which need optimization and/or the need for training of lab personnel. On the left side of the window, expand ‘Method Analysis’.
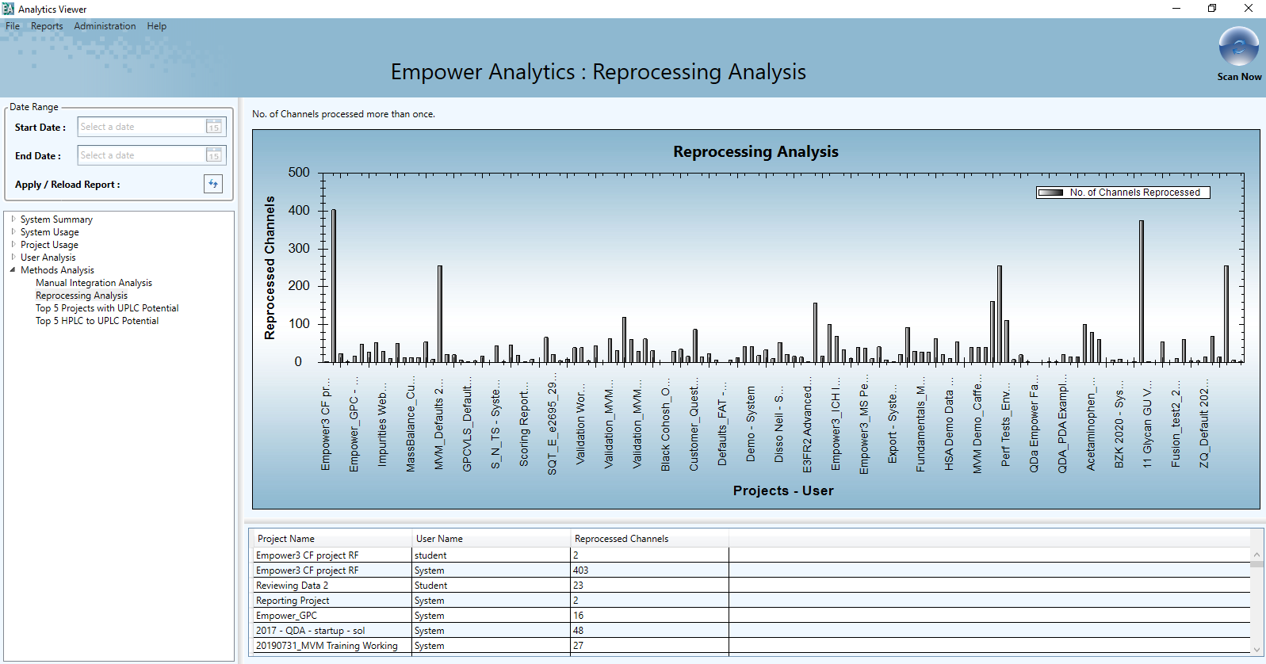
- Click ‘Reprocessing Analysis’. You see both a graphical and tabular display of the projects and the number of channels reprocessed within those projects.
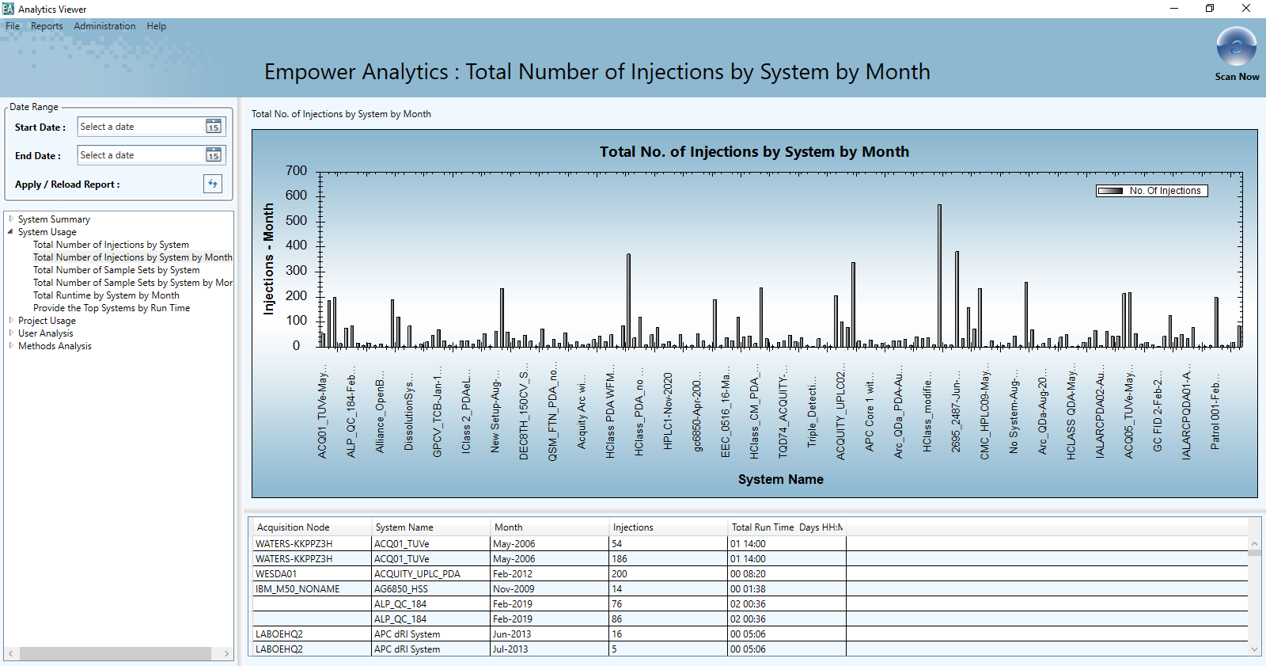
- Now let’s now look at chromatographic system usage. Expand ‘System Usage’ and select ‘Total Number of Injections by System by Month’. The display shows the chromatographic system, which node it is connected to, and the number of injections made with that system per month.
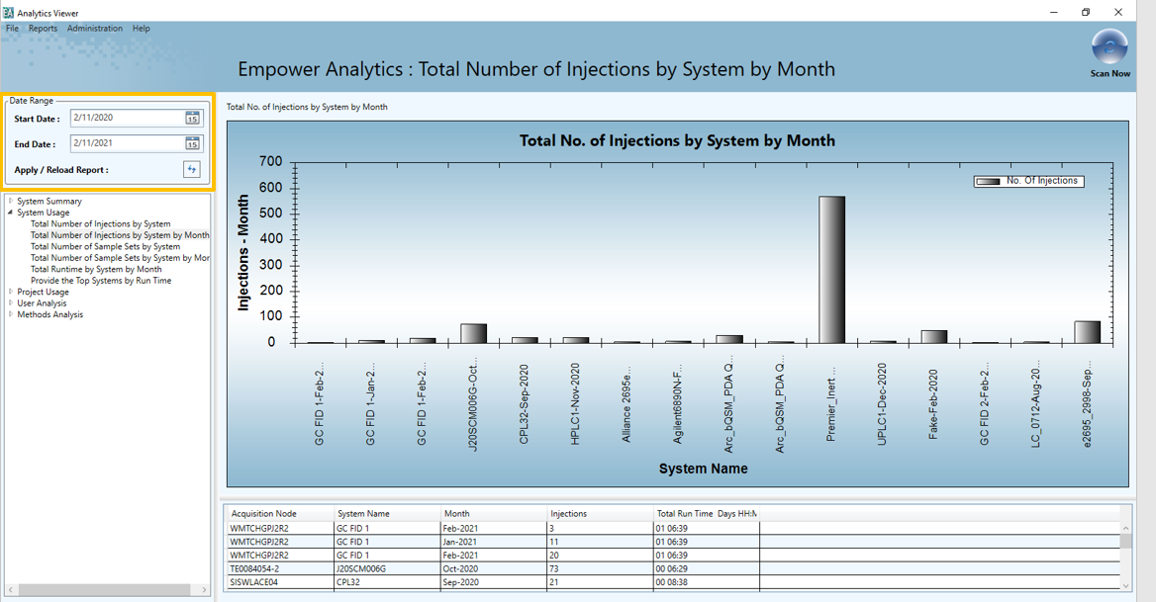
- Since dates are involved with the previous selection, you can narrow down the date range. In the upper left-hand corner of the window, select a ‘start and end date’. Click the button to the right of ‘Appy/Reload Report’ and now the dashboard displays the data within that date range.
ADDITIONAL INFORMATION
Final Note: You can use either the Pro or QuickStart interface for this tip.