What window in Empower views both PDA and QDa data at the same time? - WKB9907
Article number: 9907
ENVIRONMENT
- Empower 3 FR2, FR3, FR4
- ACQUITY UPLC PDA Detector
- ACQUITY QDa Mass Detector
ANSWER
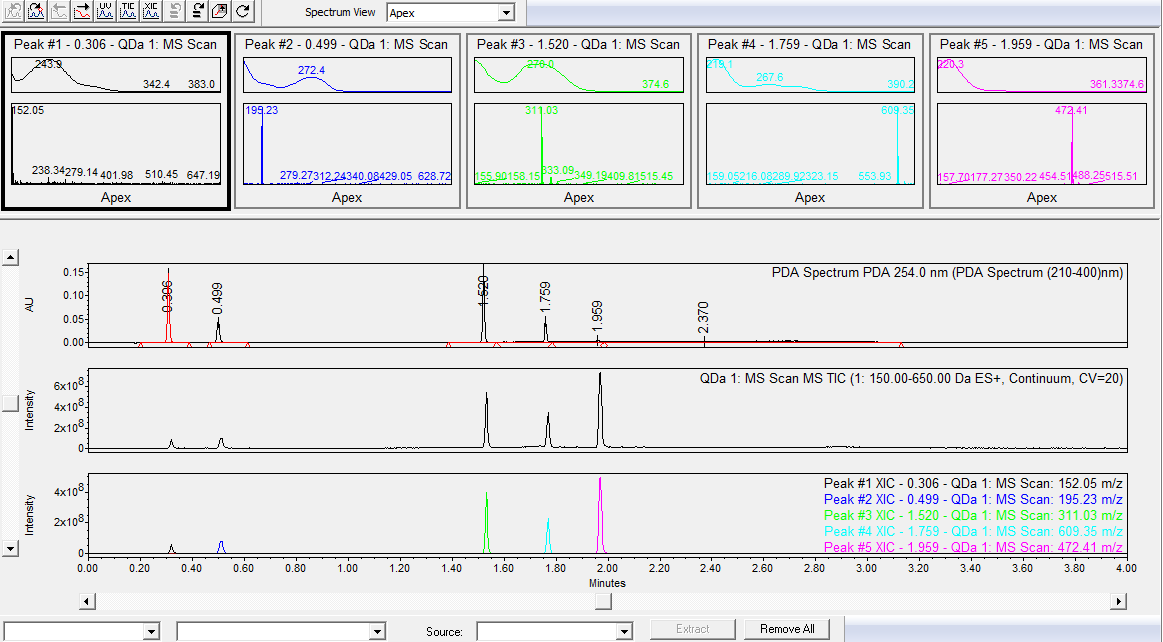
You can view both PDA and QDa data in the mass analysis window in Empower. To view this window, go to Window > mass analysis. Spectrum plots for PDA and MS spectrums are at the top where you can adjust the view among apex, combined, and purity.
By selecting these buttons  , you can view the UV data, TIC plot, or XIC channel can be viewed all together or separately. Those are on the bottom of the mass analysis window.
Mass analysis window:
ADDITIONAL INFORMATION