How to display the lambda maximum wavelength in spectrum on Empower 3 report? - WKB94476
OBJECTIVE or GOAL
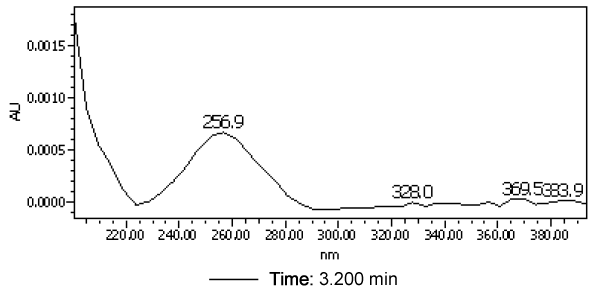
- Display the lambda maximum wavelength in spectrum on Empower 3 report
ENVIRONMENT
- Empower 3
PROCEDURE
1. From the report group tree on the left side on the Report Publisher screen, double-click PDA/MS group > Extraction Plot > Extract Chromatogram @ 254nm to add to the Report display screen.
2. Double-click the Extract Chromatogram @ 254nm on the Report Publisher screen.
3. Right-click the first row of the table on the Chromatogram tab of the Extraction Plot Properties screen and select Delete Row.
4. Make the following settings on the "Spectrum" tab of the Extraction Plot Properties screen.
*For the extraction time, enter the peak retention time
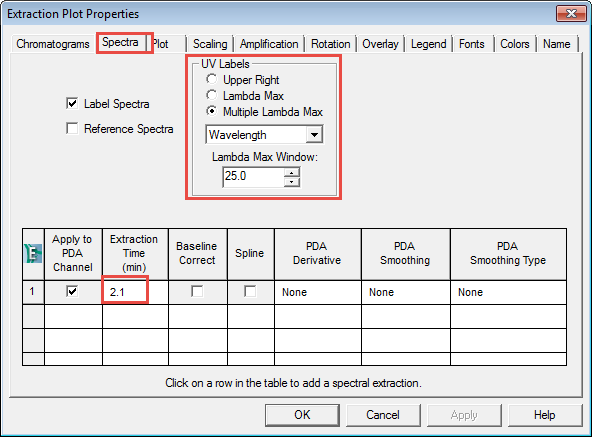
5. If the wavelength is not displayed, gradually decrease the value of "Lambda Max Window".
* In the case of "Match Plot" or "Spectrum Index Plots", you cannot make detailed settings like when using "Extraction Plot",
so the lambda max may not be displayed if the lambda max is unobtrusive in the spectrum.
If it is an Extraction Plot, it can be adjusted by the above procedures, but since it cannot be adjusted in the Match Plot or Spectrum Index Plots, it cannot be displayed in that case.
ADDITIONAL INFORMATION