Empower 3: How to calculate the mean or %RSD (Relative Standard Deviation) of multiple results with the report method? - WKB121029
OBJECTIVE or GOAL
- Calculate the mean and %RSD (Relative Standard Deviation) of multiple results with the report method
ENVIRONMENT
- Empower 3
PROCEDURE
1. Preview multiple results on the Project window and open Report Method Editor window
2. Double-click on the blank region of the report page, change the report type to "Summary All" on the Method Properties window, and click OK
3. Double-click on the peak table to open the Table Properties window
4. In the table part on the "Table" tab of the Table Properties window, click the title of the "Area" column to highlight it in black.
5. Click the Column Properties button.
6. On the Column Properties window, double-click Mean, Std.Dev.,%RSD(Relative Standard Deviation) from the list of summary functions to be applied.
Add to the table on the right and click OK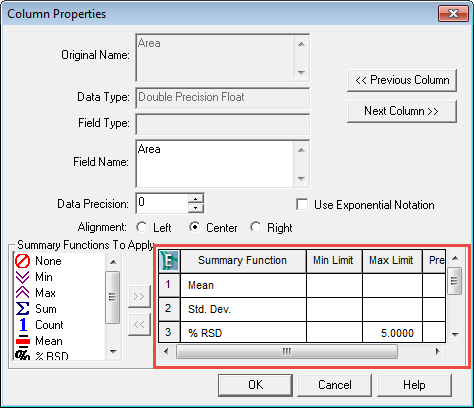
7. On the "Order By" tab of the Table Properties window, select "Name" for Group By and click OK.
* This setting allows separating the tables per peak name.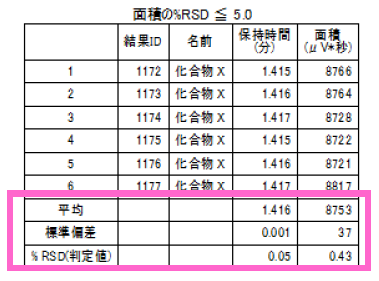
ADDITIONAL INFORMATION