The cumulant fit doesn't work for my data, but the regularization graph only shows one peak. Why is this happening? - WKB319081
ENVIRONMENT
- DYNAMICS
- DYNAMICS software (version 7.8 and higher)
ANSWER
The cumulant fit may not work correctly even if the regularization graph shows only one peak because small species might be hidden due to size range restrictions. In DYNAMICS software, you can adjust the Peak Radius Low Cutoff under Parameters → Fixed to a smaller value (e.g., 0.1–0.5 nm) to reveal these hidden peaks. Additionally, the software allows filtering peaks by Minimum Peak Intensity, with a recommended threshold of 1%. These settings help ensure that smaller excipient species are properly displayed. This explains the discrepancy between the cumulant and regularization fits.
ADDITIONAL INFORMATION
The cumulant fit doesn't work for my data, but the regularization graph only shows one peak. Why is this happening?
In the graph below, the blue autocorrelation function (ACF) is fit by the regularization model (purple) and not by the cumulant model (brown). In addition, the %PD for cumulants is reported as multimodal.
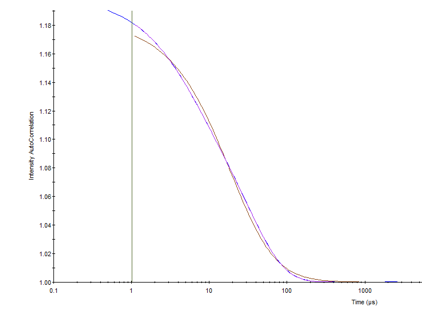
However, if the regularization view shows only one species. Why would the cumulants fit not be correct?
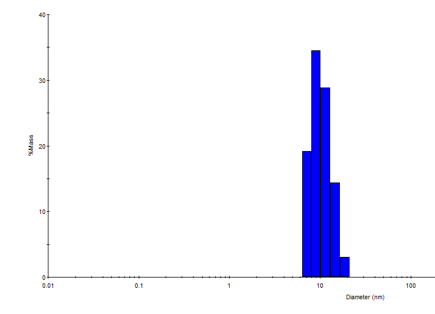
What is happening is that a small species is not being displayed in the Regularization graph. DYNAMICS software has the ability to restrict the regularization size range. You can check and adjust this in your data file by going to Parameters → Fixed and changing the Peak Radius Cutoffs. Changing the Peak Radius Low Cutoff to a smaller value such as between 0.1–0.5 nm will allow you to observe any additional small peaks in the Regularization graph.
DYNAMICS (version 7.8 and higher) also has an option to filter out any peak by Minimum Peak Intensity. The recommended value for this parameter is 1%. You can set this to filter out smaller excipient species.